


I've been away from blogging for several months now. come back this time because there is something to release It's a program that I've been wanting to do for a long time. But I don't have time to do it. Because he is just going to pump sales. Just like our past promotions very successful So when I have time for me (Nan) to take a breather and do something else, heh heh. I created this program for you named SystemZ!
For this SystemZ, it's not really an add-on program. because it is a file HTML+JavaScript written as a Single Page App (SPA) with Angular JS (old version The new version of TypeScript, haven't had a chance to try it yet, and have seen it and don't like it) and use Chart JS to display graphs.
So why is SystemZ not written as a general program, but as a SPA ? that's because I intended from the beginning that Want to make it a Browser Source on OBS means that we will be able to compress the screen or LIVE with Overlay as various information of the machine. without being constrained by the same display. of other programs that has ever been like this
And don't have to have it show up on the screen when we play our games. Let's spoil the taste as well!
The important thing is that it can customize the display itself everything. By editing the HTML code easily~!!!
Get started with SystemZ.
For SystemZ, it is part of SystemX. You can see the SystemX post to see how to install it.
After installing it, when you start SystemX for the first time. The program will ask to register. can be turned off Because the SystemX program is designed to be used with the LEVEL51, if it is a different brand, it is not very relevant. No registration is required :) If it's a LEVEL51, the program will automatically register itself. do nothing but if unable to access You can inform us via inbox for us to register.
After SystemX is enabled, a 51 icon will appear in the Tray, right-click on it and select SystemZ Link.
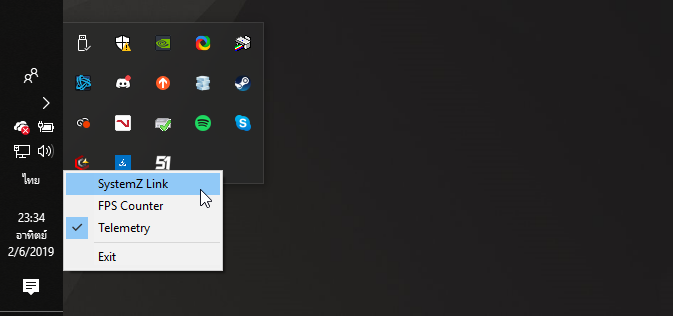
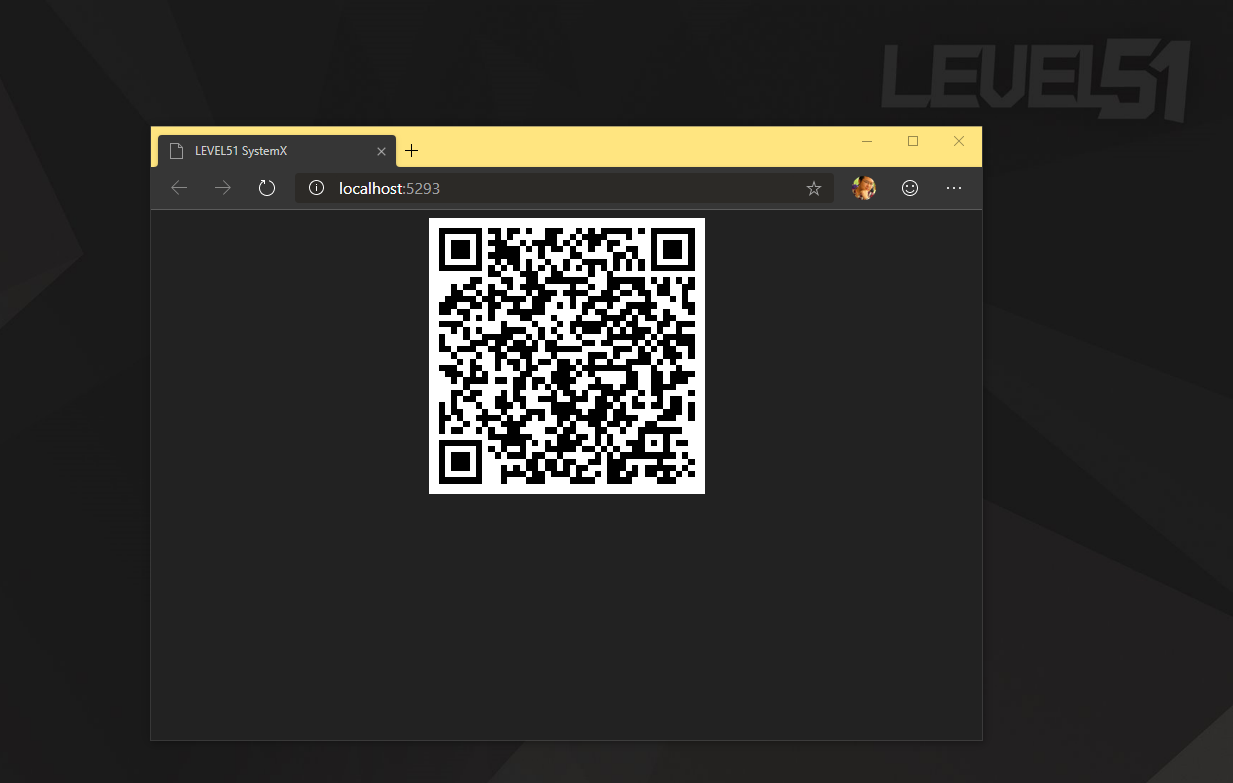
This will open the Browser page and on the screen will display a QR Code. You can use your mobile phone to shine this QR Code to receive a link that can be used to view SystemZ. The mobile phone must be connected to the same network as the open device. SystemX (for example, if your SystemX powered machine is plugged into a Lan cable to your home router, your mobile phone must be connected to the same WiFi network).
If you want to continue watching from outside via the Internet It can be done by going to Forward Port that the router provides to Port 5293 of this machine. How to Forward Port has not yet been mentioned in this post. It will be too off topic :) PS. When you click to open the QR Code for the first time, SystemX will automatically open this Port in Windows Firewall.
After that, in the mobile phone, you can open SystemZ at all, and of course, if you open it with a browser on the device as well. all the same by using this link
http://localhost:5293/systemz/index.html (Actually, I'll just make a button and put it in the QR Code page as well, just remember...)
For those of you who have a more complicated Network device, such as having multiple Private IPs, put VMWare/VirtualBox in it, the program will choose to remove the first IP that is IPv4, it might get an invalid IP. This requires entering the IP of the machine itself.
how to use
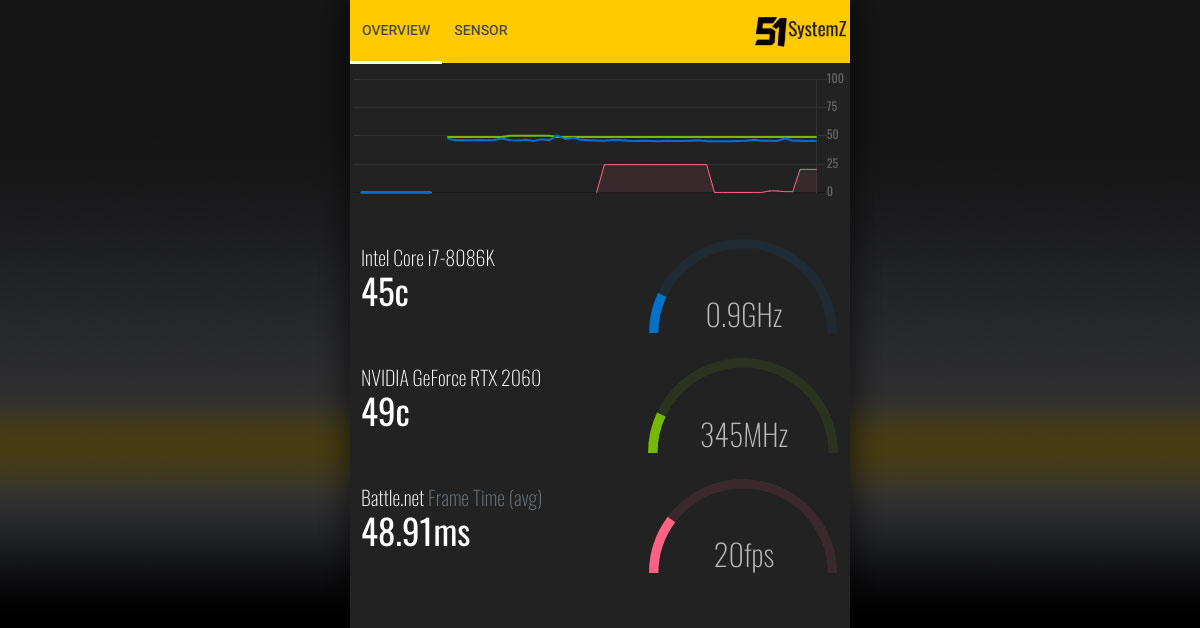
Operation of SystemZ is very straightforward. The first screen is divided into two main sections:
- History graph. Let me call it a Timeseries graph. It 's the name that I'll use soon to call it when I adjust it again. In this graph, there will be 3 lines displayed.
- The blue color (sniffed from Intel) is the CPU temperature in degrees Celsius, the graph is on a scale of 0 - 100, so if it's in the middle. Shows that the heat is about 40-50c.
- Green (which sucks a lot from Nvidia's website) is the temperature of the GPU.
- Red (this one has a random color) is the history of Frame Per Second (Fps) of the program that was at the top at that time. But normally the red line will not show. In addition to selecting the FPS Counter option in the 51 icon
To enable SytemX to capture Frame Per Second as well, you'll need to click the "FPS Counter" option in the 51 icon first. The method for capturing fps is the same as Intel's PresentMon program , using Windows' ETW system, which has Impact . with game performance Much less than the common Dll Injection/Dll Hook implementations (eg Fraps, RivaTuner Statistics Server), but it does exist. And it doesn't need to be open all the time. If you don't think to use it, because nowadays, the screen of Windows programs uses DirectX to display, so it will have Fps effect all the time without a need. Like Battle.net program here, draw the screen. with DirectX as well
PS. SystemX doesn't use PresentMon program. Use to talk to ETW directly.
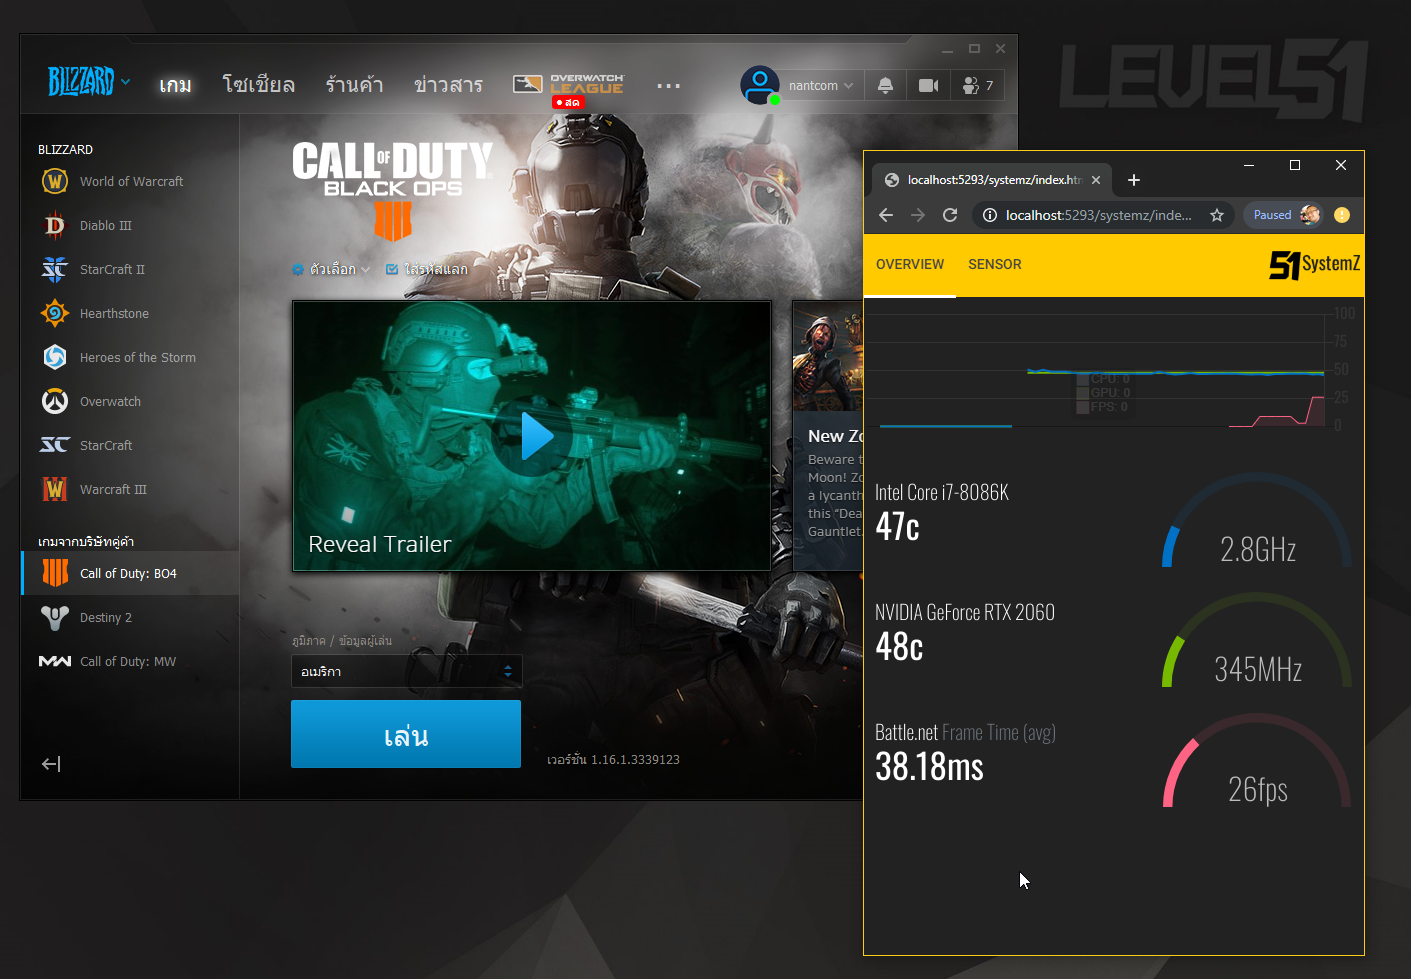
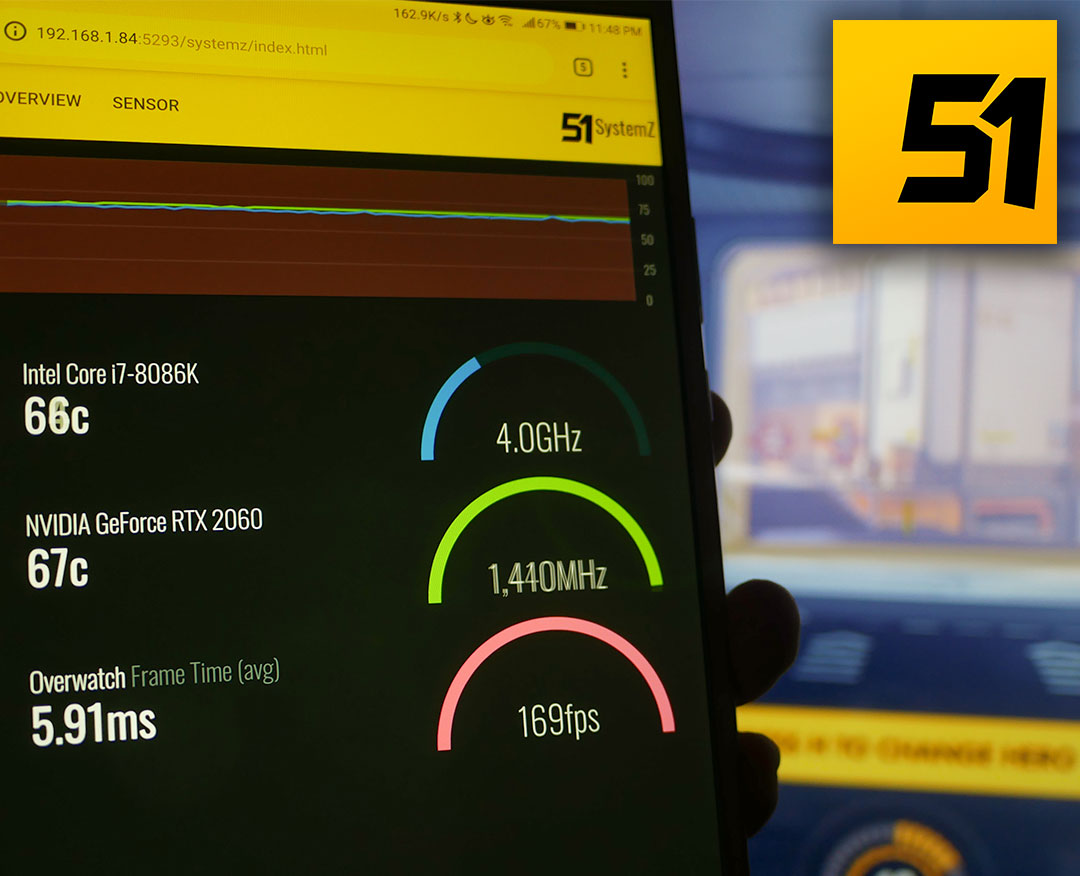
Below it is a Panel that shows similar information but is shown in numbers. Along with a semicircular arc that will be called Gauge (read as gauge).
- The blue gauge is CPU Utilization/Load. If it runs almost full or full, then the CPU is 100% utilizing and the number in GHz is the speed at that moment.
- The green gauge is GPU Utilization/Load based on Graphics Core only, now it includes Memory Unit Load, Video Unit Load, not combined.
- The red gauge is the Fps level, if full it means the Fps is 100 or more at the moment, if it is mid then the Fps is 50-60 then it's smooth. If it happens to be almost full is a slippery slope
- The numbers in the Frame Time (Avg) will show the program name. At that time it was working on the top (Foreground Window), as if we had the game open. but does not click on the screen It is not counted out. This number is the amount of time between images (frames) in the game. The unit is milliseconds (ms) . Of course, the smaller the number, the better. The number shown is the average (Average, Avg) from about 1 second or 100 frames ago. If the Average is relatively stable, it's good. We take this Average. Let's calculate in Fps again that on average in the last round, how many frames per second did you get?
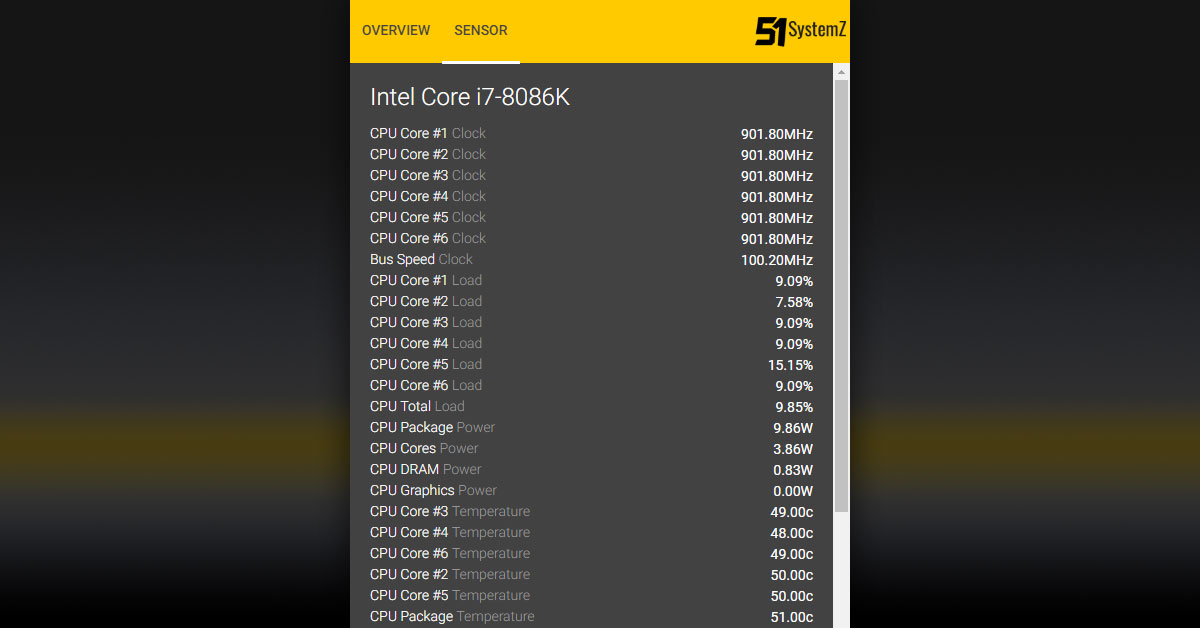
If it happens that it's Geek than that, there will be another page called Sensor to see all Sensor data that SystemX can read out as well (which SystemX uses a library called OpenHardwareMonitor , which I forked to fix a few things to make use of with SystemX conveniently
For using SystemZ to view information It will be like this Do you have any plans to do more? I'll just have to wait for another moment :D
How to use SystemZ Overlay
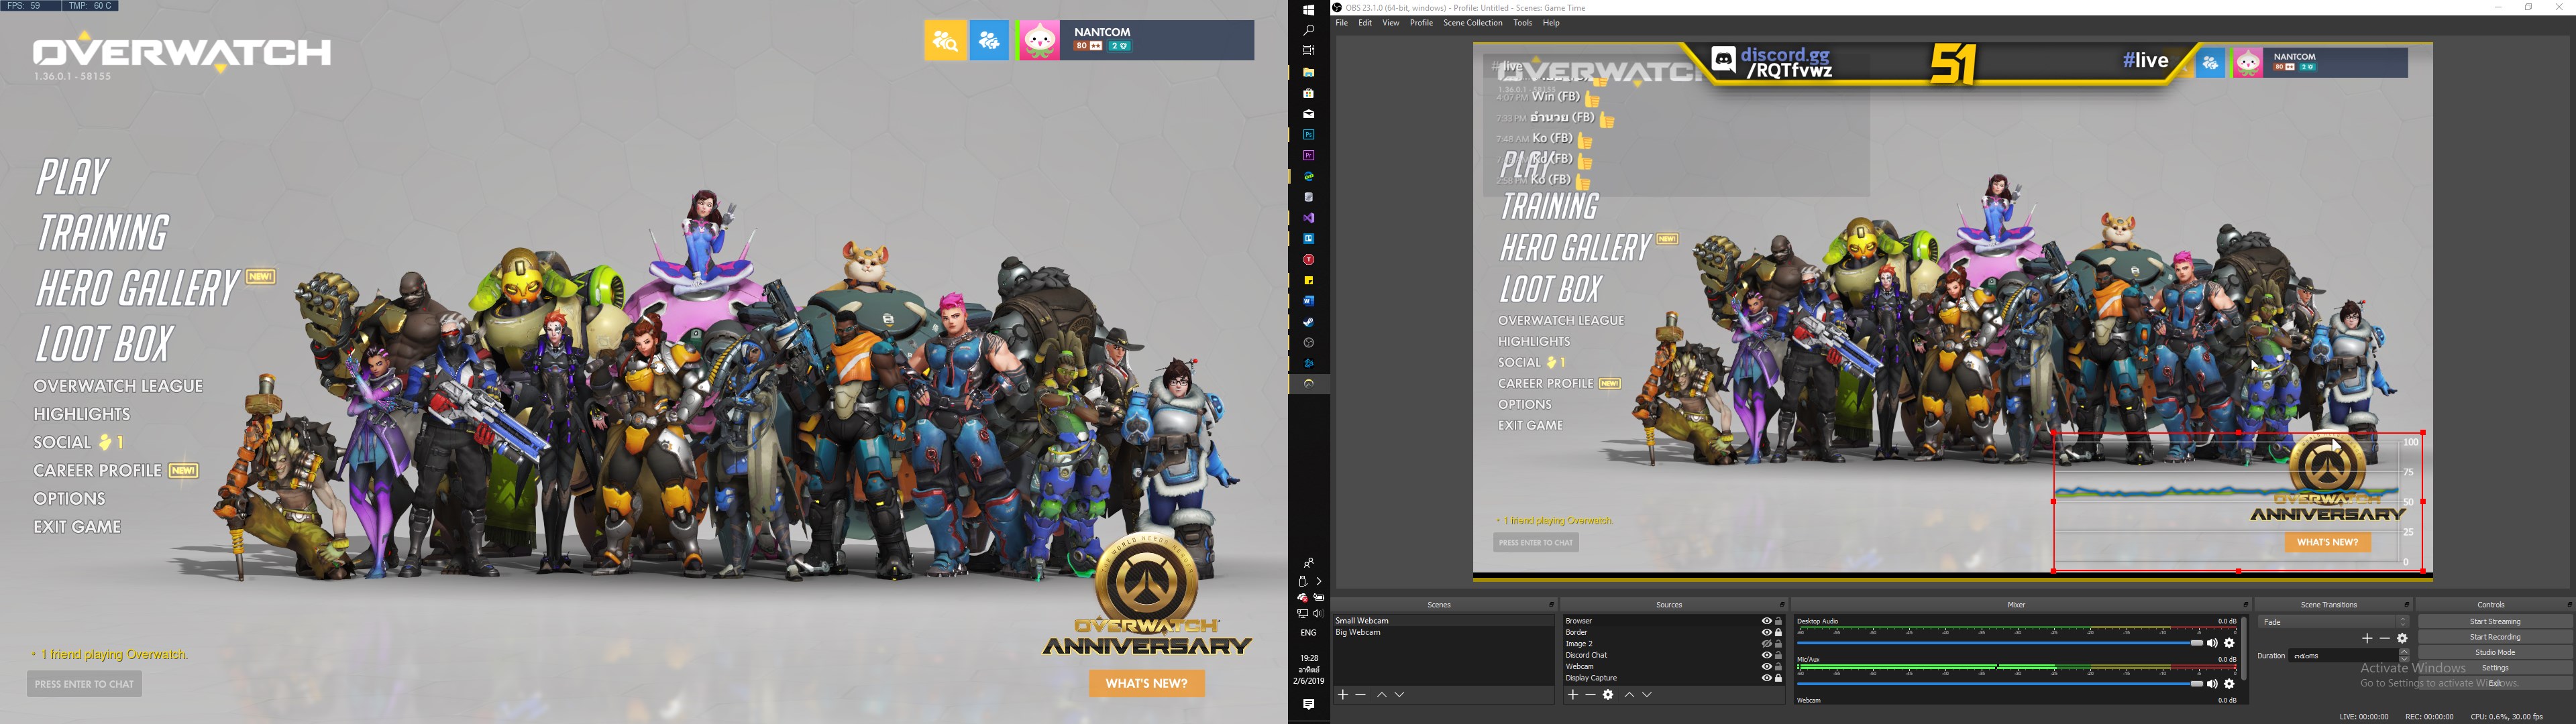
OBS has a type of Source called Browser Source from which we can remove web pages. to display overlay on our Stream (or Record) as I said before I designed SystemZ to be a web site because it allows it to be able to overlay because of this.
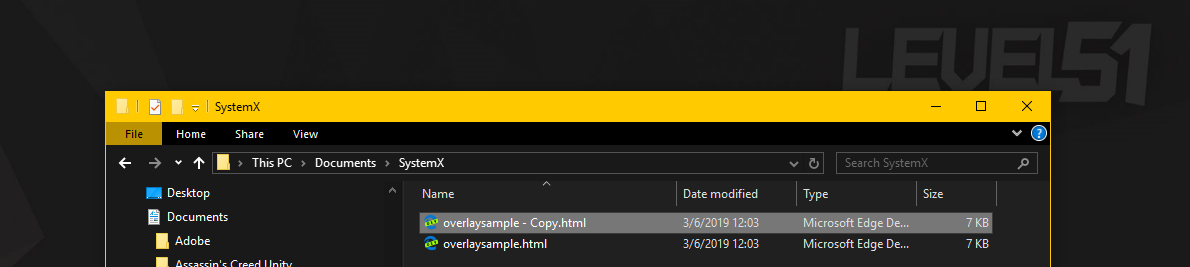
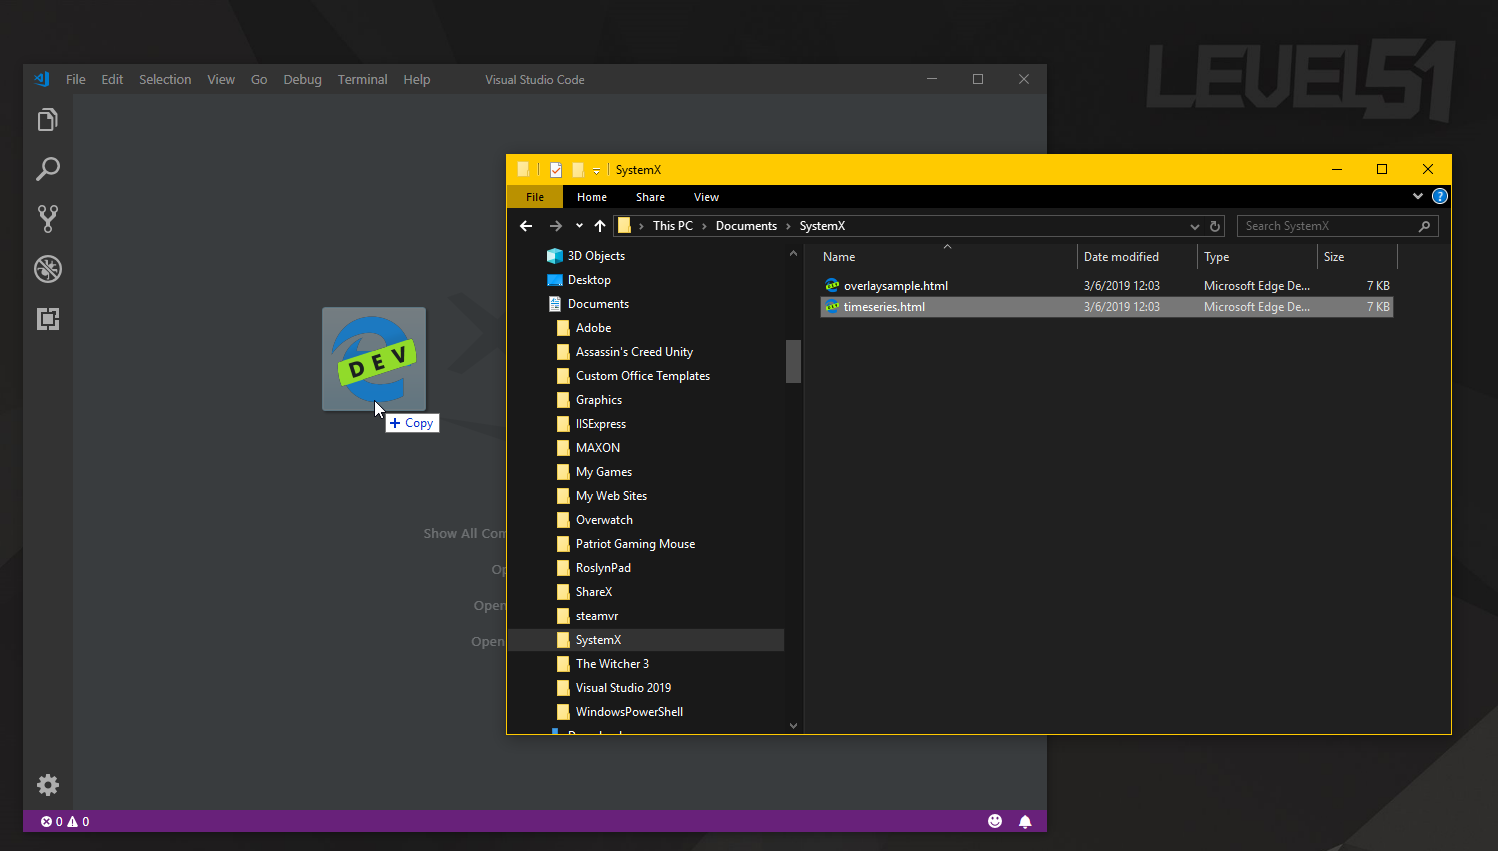
The first step is to copy the overlaysample.html file located in My Documents / SystemX out of the overlaysample.html file. It will be overwritten every time SystemX restarts, so don't edit this file. and give it a name that's easy to type, such as timeseries.html .
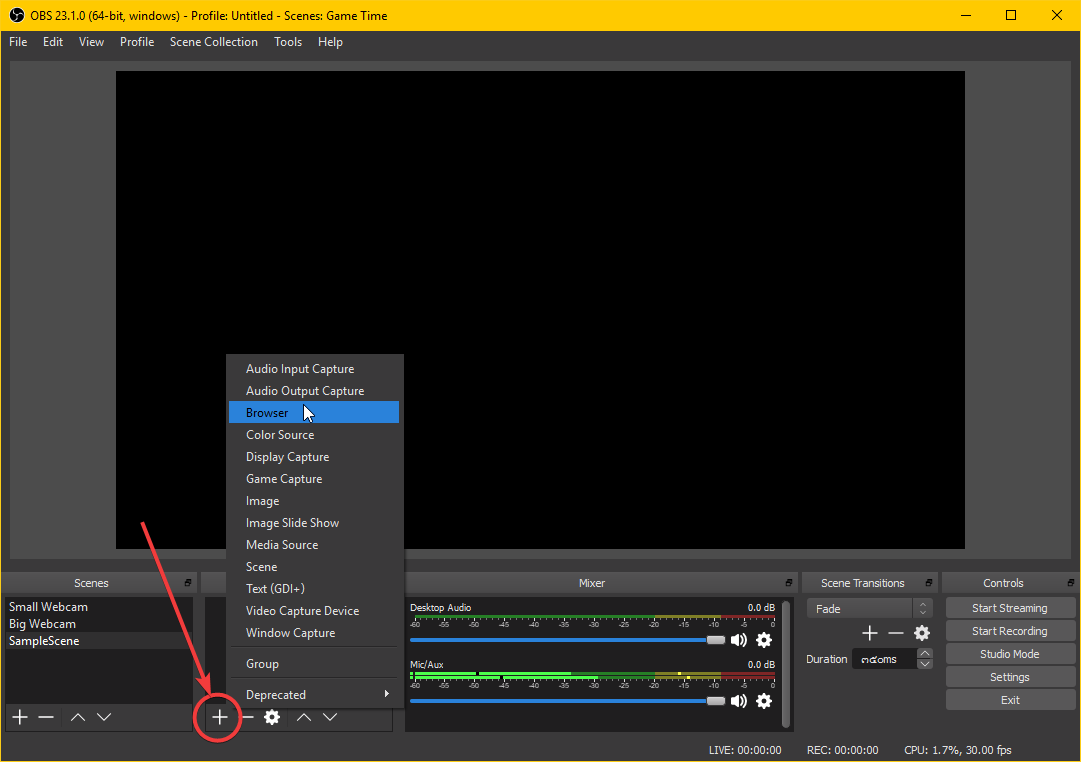
The way to do it is to press create a new scene and press the + button on the Source.
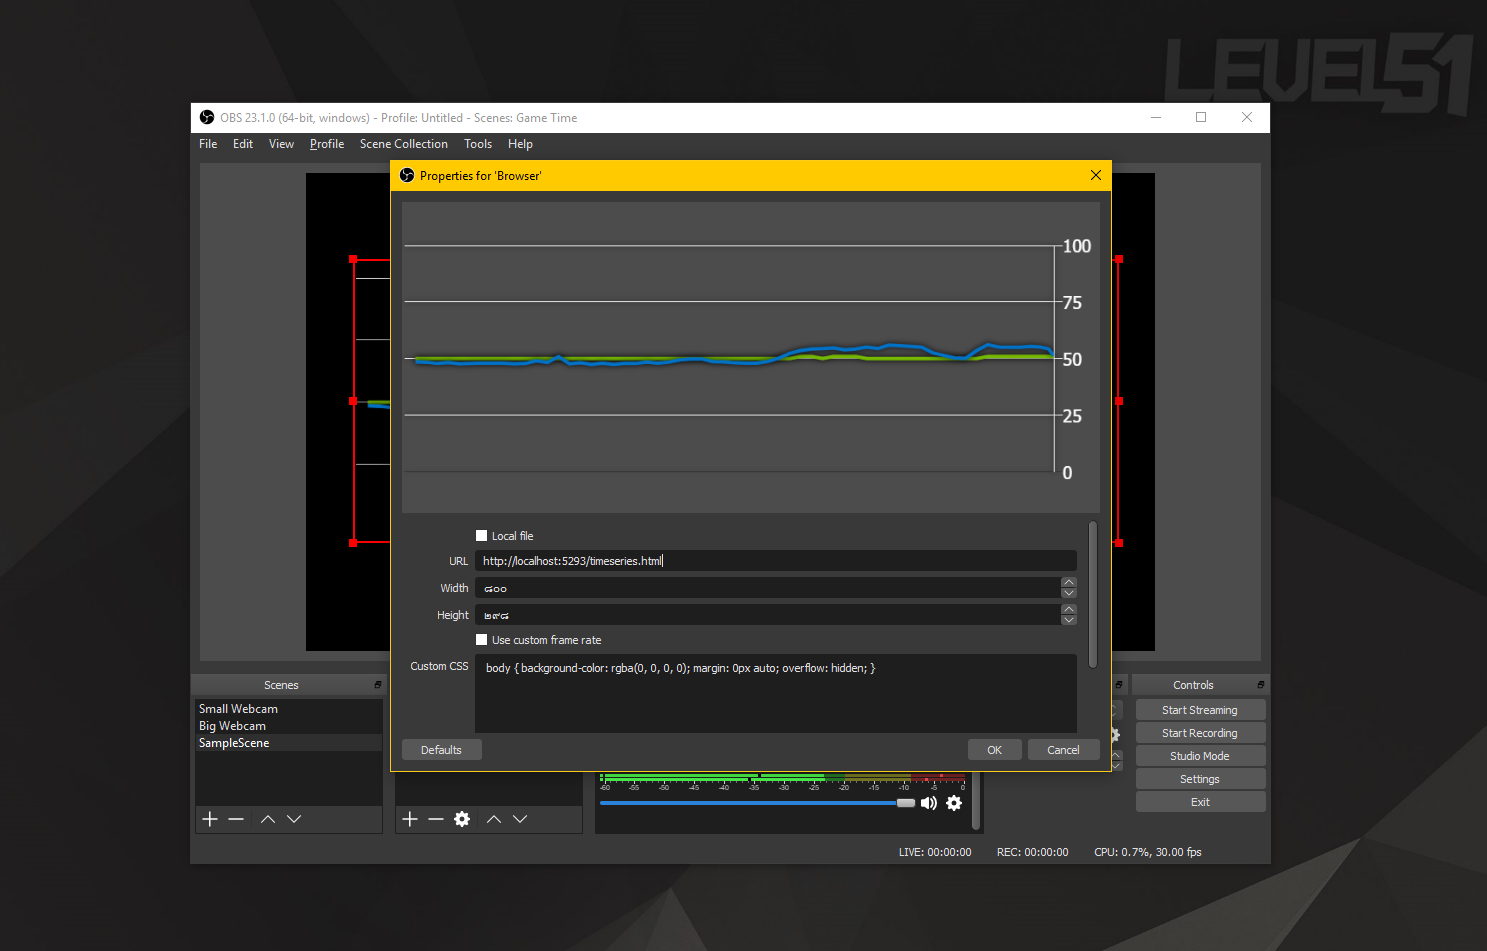
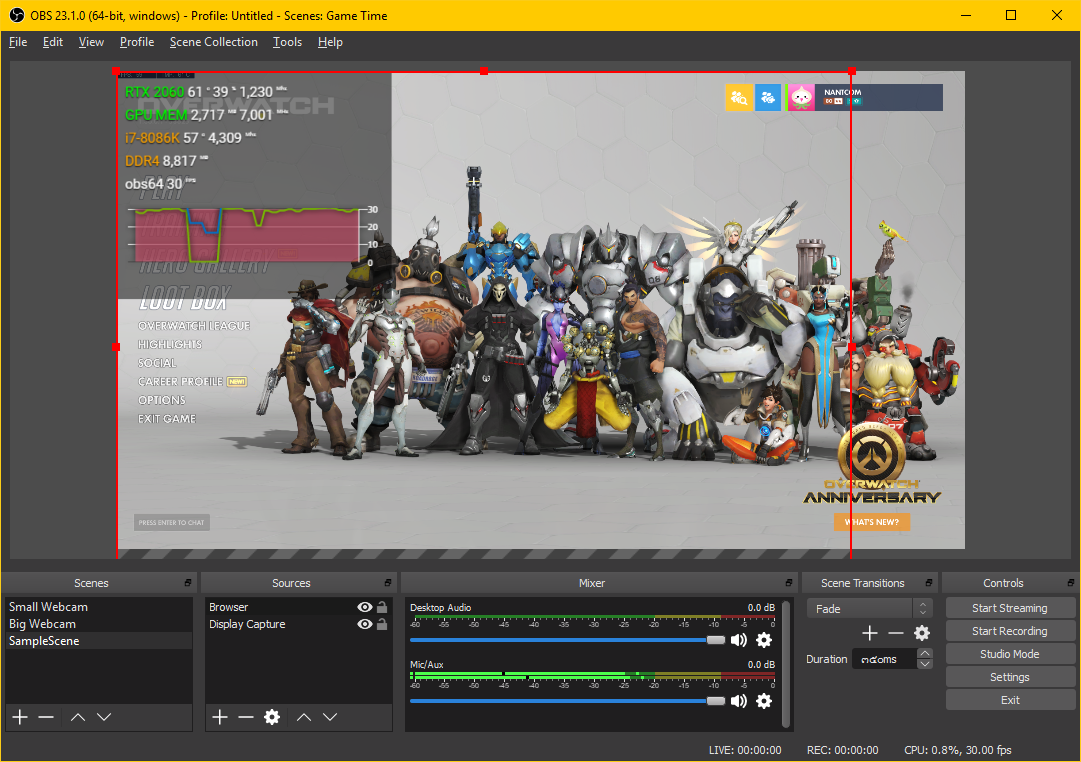
Then put the URL http://localhost:5293/timeseries.html in the box, the OBS program will display the timeseries graph like this:
If in doubt Why not use it as a Local File? If we open the .html file with a local address such as C:\sample.html like this, the Browser will have a zone to work, which may cause something to be inoperable in SystemX, so the Application Server is embedded.-in (it's NancyFx that uses the HttpListener system of Windows), calling through a URL that is http:// like this will allow us to use all the capabilities of writing a website for sure.
How to Fix Overlay (or How to Write Basic HTML/CSS/AngularJS!)
Before, I wrote a lot of tutorials on my personal website called CoreSharp.net (It's closed now There are only old information) I miss you too :D In this post, I would like to teach you how to write. HTML/CSS/AngularJS as short as enough for editing the Overlay.
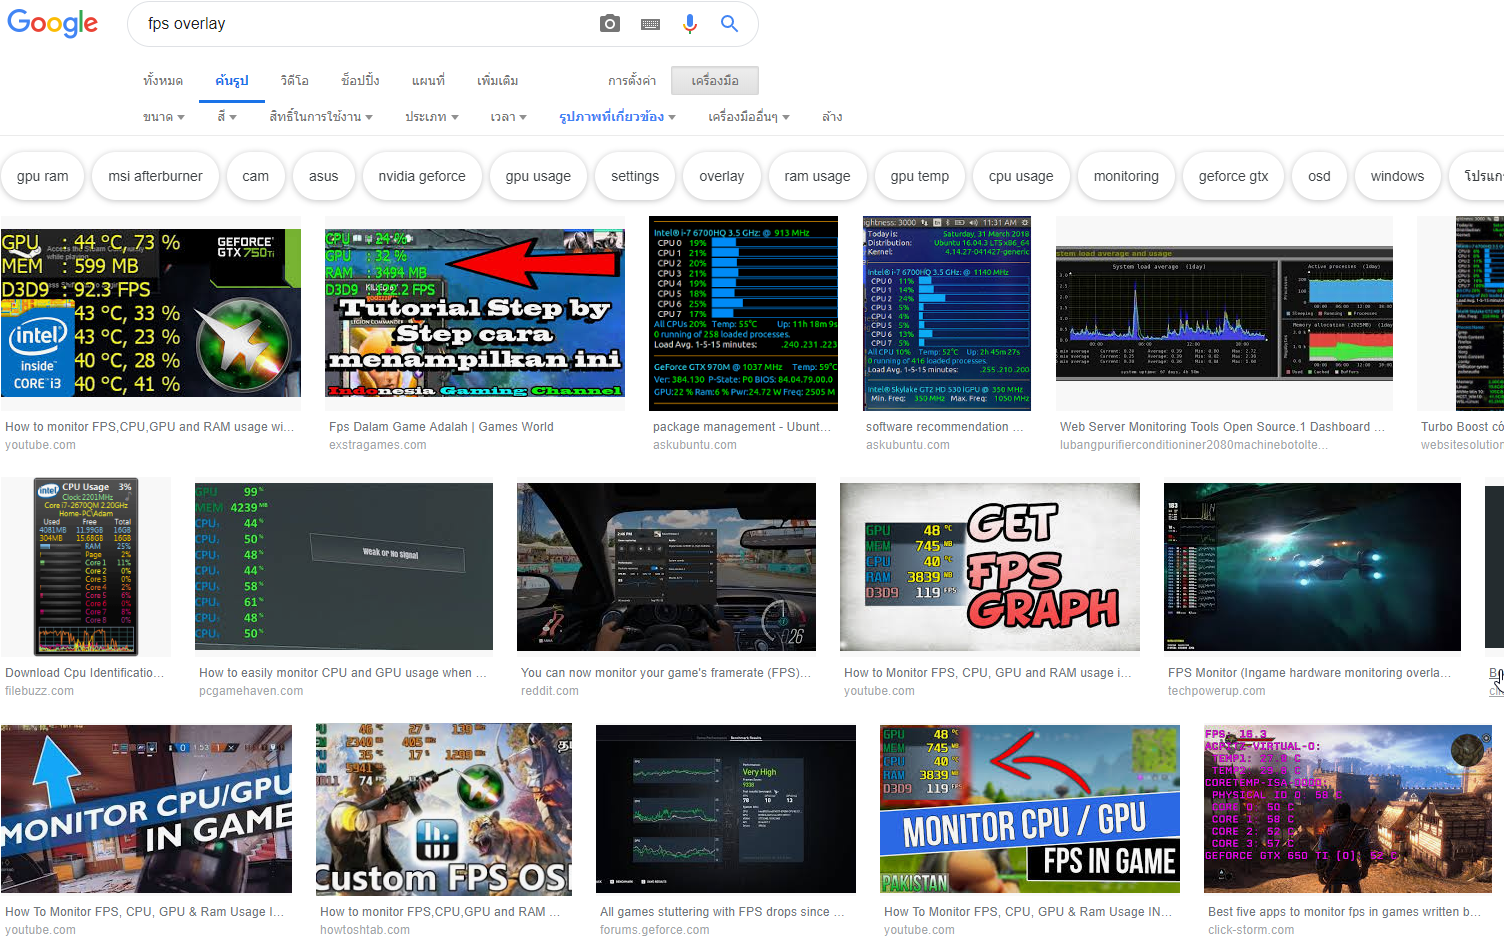
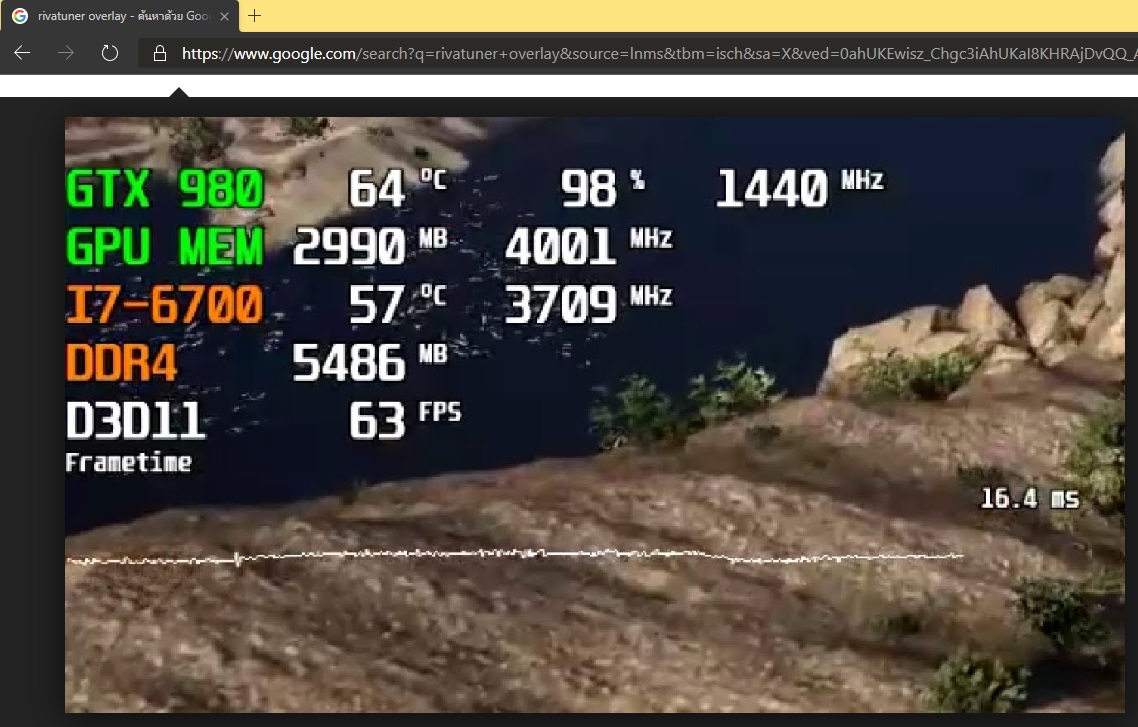
for the best way to learn to write something That is, we have to set goals first. For today's goal, we will make an Overlay according to the Design of Overlay of the RivaTuner program by using the SystemZ system. This is a reference image that I searched from Google with the Keyword "rivatuner overlay". how are you
Familiarize yourself with the HTML language first.
The tool that we will be using is Visual Studio Code . It's 2019 and you can't write a website with Notepad anymore! Click the download link, open it, and drag the file. timeseries.html that we can copy and paste
What we see in this HTML file, look and do not panic. It is the language we use to talk to the browser to control the display. Called as a Mark Up language, we will show how it will be displayed. We took this language frame the letters we want to go
First of all, to make the code screen It doesn't look too messy and scary. We can fold some of the code out. by pointing the mouse behind the line numbers Then click the - button in front to fold it, or to reopen it, press the + button or click on the folded area.
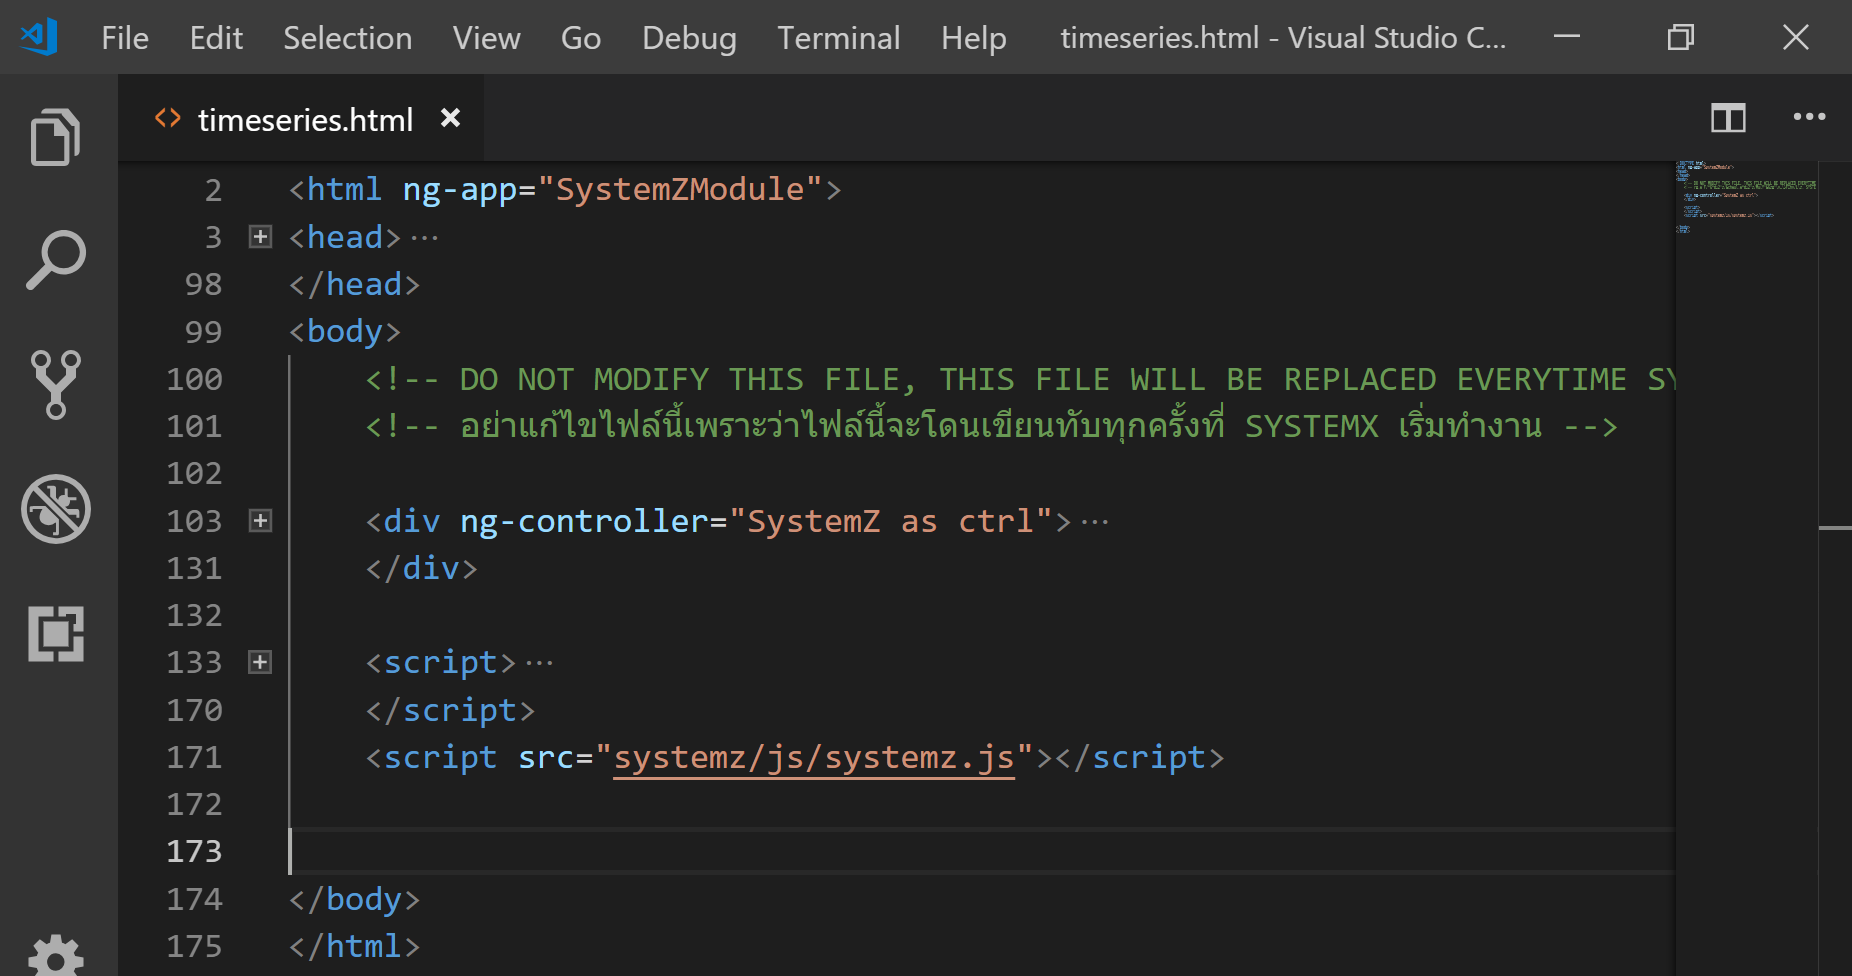
When everything is folded You will see the structure of the file. timeseries.html clearer
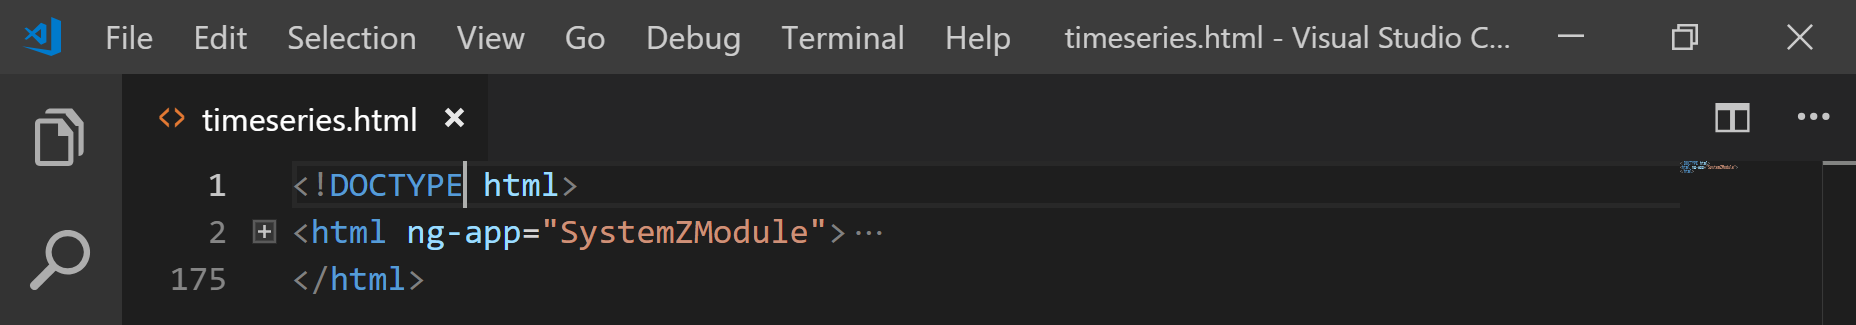
Start from the line that says DOCTYPE html . This indicates that this file is an HTML version 5, before there were many versions. But now we don't have to worry about it. (It's about ten years ago) Just enter html, you know.
When we spread the html, we will see that it is <head> and <body> inside <html> again. This html, head, body is called Tag, and we will see that the nature of the Tag is that it can be nested.
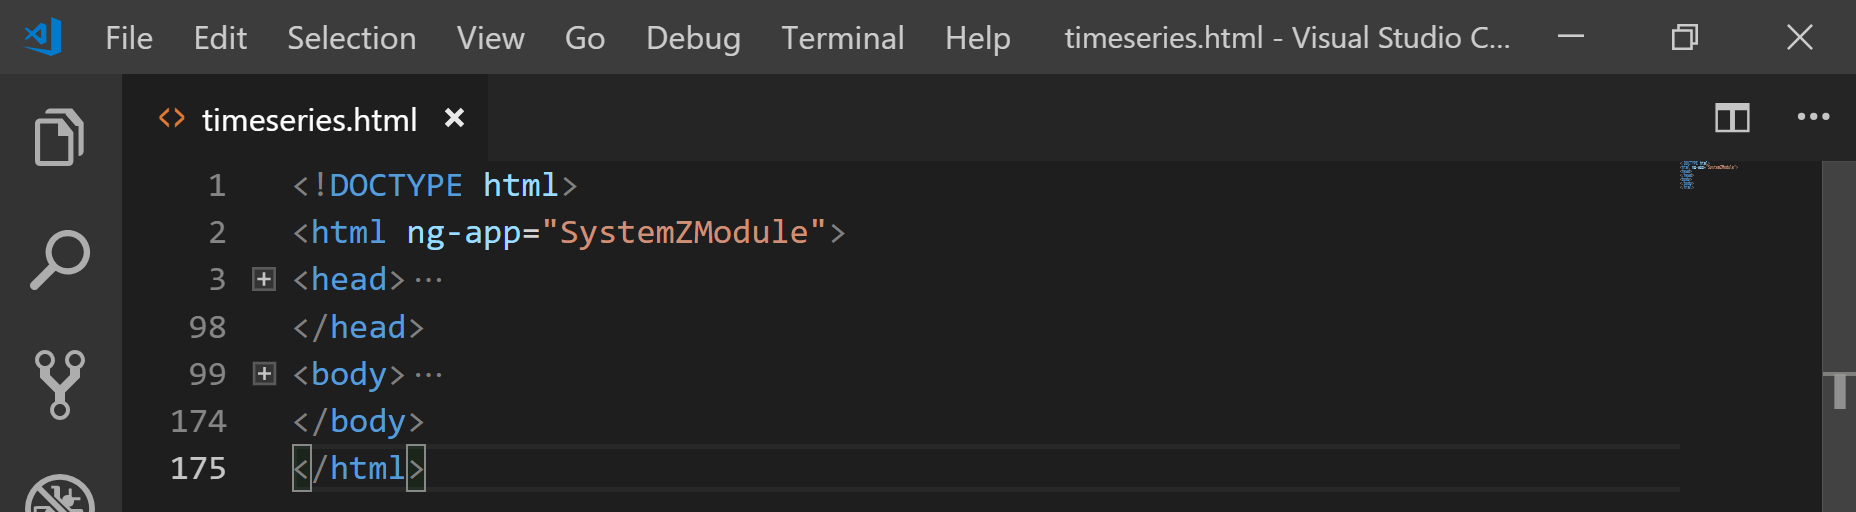
When you try to spread the body out, you will see that there is a Tag div and script inside and there is a green message. This green color is called Comment to write a supplementary explanation in our code. what it is what did we write Maybe many of you will write very complicated code. After reading it, I don't quite understand. Having a comment like this will make it easier to read the code.
Move to look at line 103 (you can press CTRL+G and type the number 103 into it) you will see that it is a Tag div that covers the canvas .
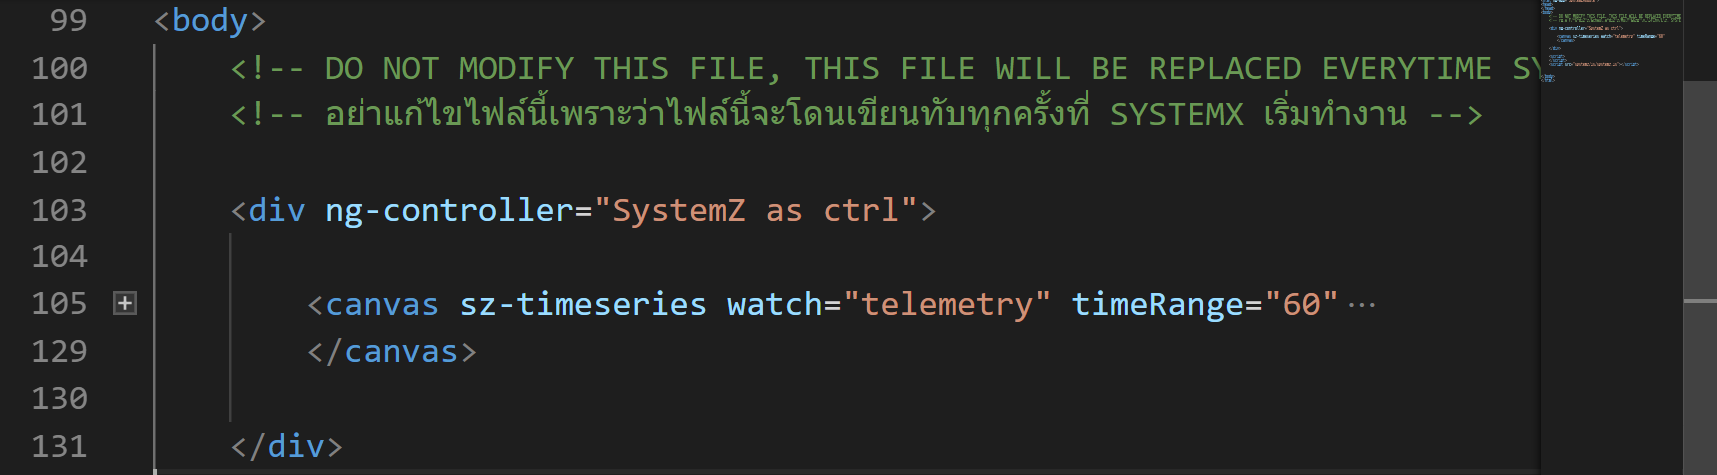
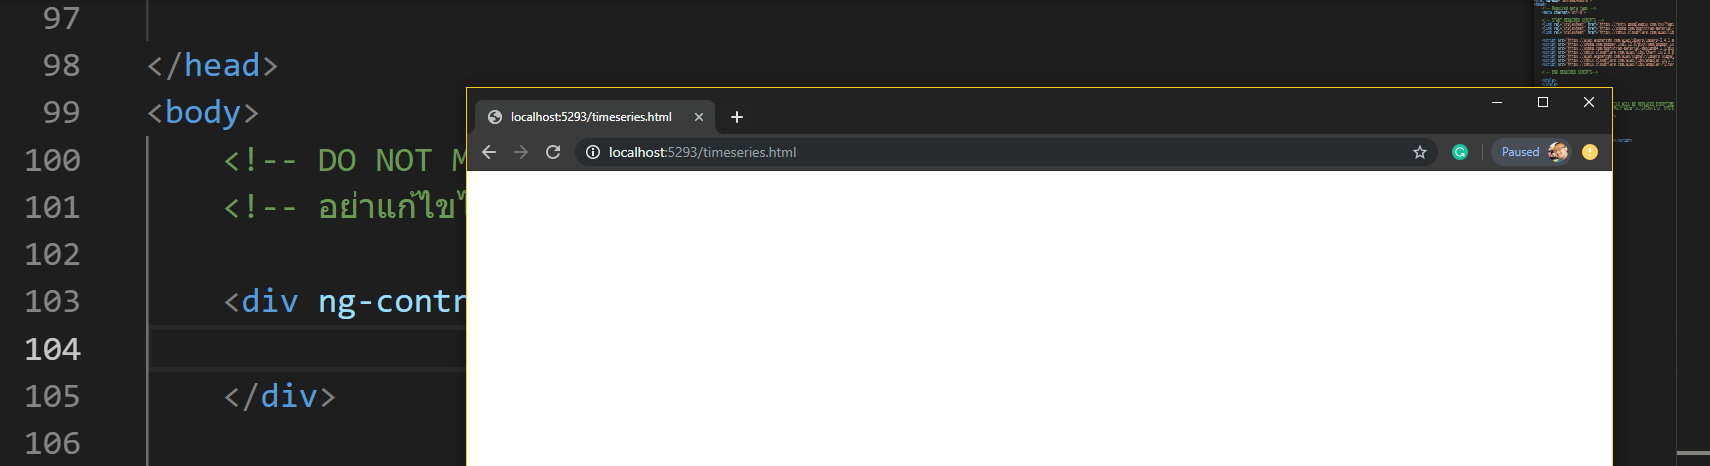
Can you guess what canvas is? :D If you can't figure it out, try deleting it (from lines 105-129), then save (CTRL+S) and open http://localhost:5293/timeseries.html with Chrome (or any other browser). Found that the graph had disappeared. It becomes a blank page like this.
HTML language will look like this, that is, we have tags nested over and over, each Tag has its function to show what will be displayed. And how will it be displayed initially? For example, if we want to display the message saying hello in bold, we will write like this.
<strong>Hello</strong>
Then try to type in between the Tag div. Notice that when typing, there will be Auto Complete coming up as well. When Auto Complete selects the right one for us, then press the Tab button to allow it to finish typing for us. All we have left is to type > into the Visual Studio Code and it will print the Tag behind it for us.
and will see that while we type, </div> will show up in red, converting that we haven't written something completely because the tag must have <div> (open Tag) and </div> (close Tag) like This always matches
And to get used to it, we can split the screen in half by pressing the Windows key + left arrow or right arrow to arrange the window to type our code. You can paste it with your browser window like this. We can also press CTRL+S to save, ALT+TAB to switch to the Browser screen, then press CTRL+F5 to Force Refresh the Browser window. Do this until you get used to it. It will allow us to write more fluently.
There are two types of HTML tags:
- Block like div p h1 h2 h3 h4 h5 h6 ul ol li section Tag like this It will take up 1 line of space for the entire width of the screen.
- In-line like span buio Tag like this, it will be text. That is, we can't wrap span on a div, but span can be inside a div.
Which actually has a lot more tags than this. but that we use often There will only be an example. I want to know what it will look like. Just try typing it in the code, it's just that li must be in ol in ul. Let's see how it works.
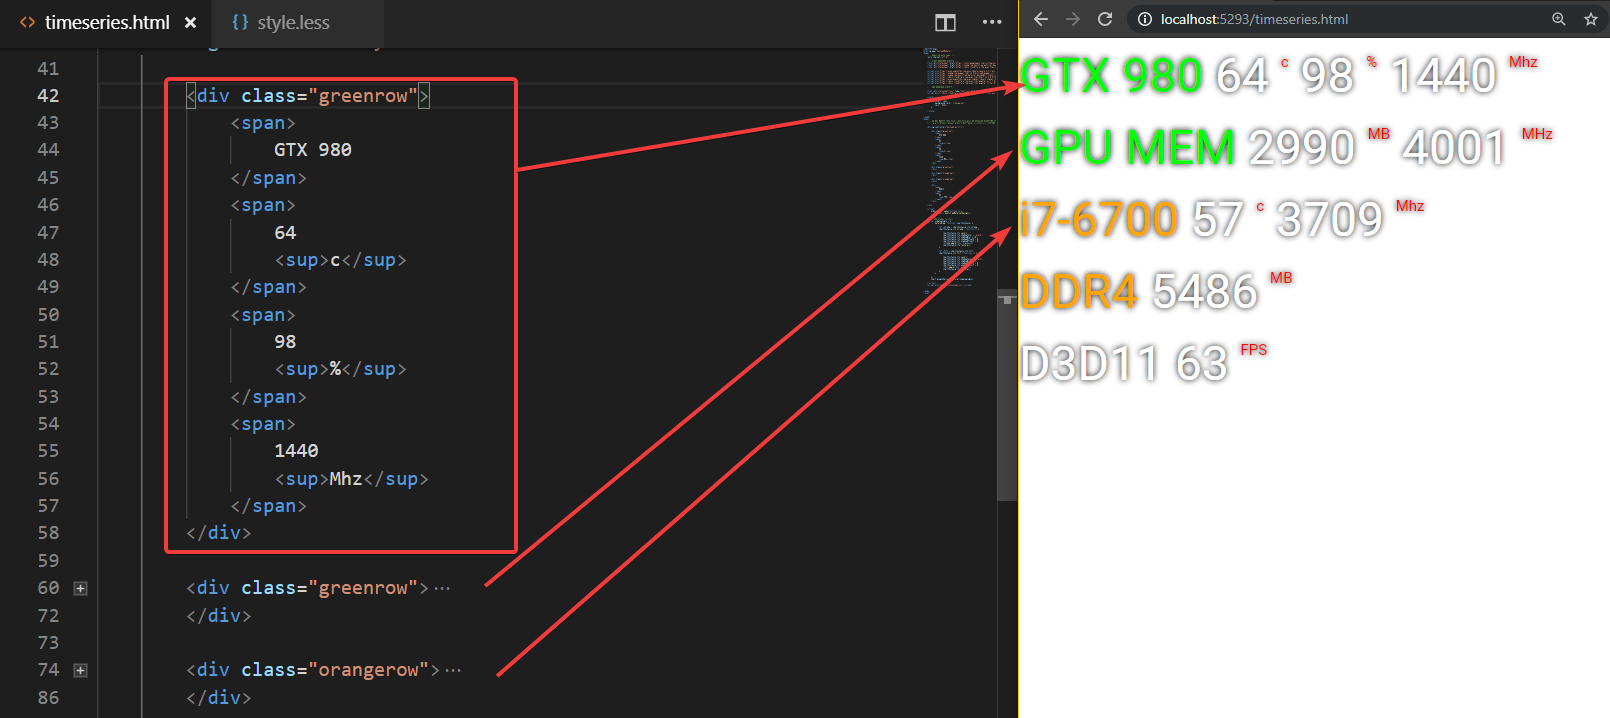
Now let's try and look at this reference picture again. How can we write it out as an HTML Tag?
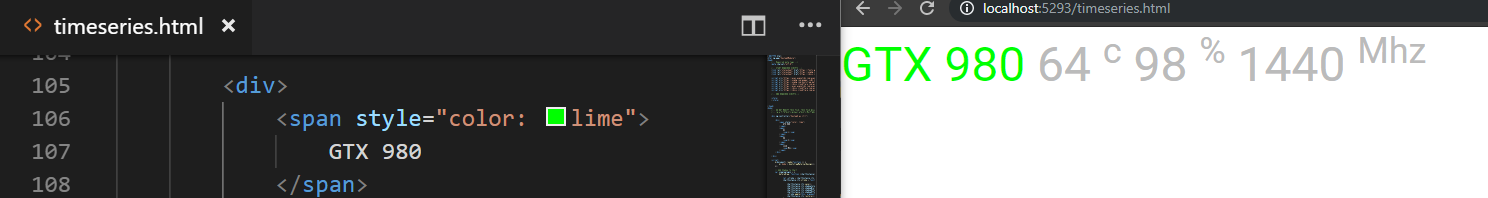
You will see that there are 5 lines of text. We will only focus on the first line first.
In this line we can see that It's divided into 7 parts like this.
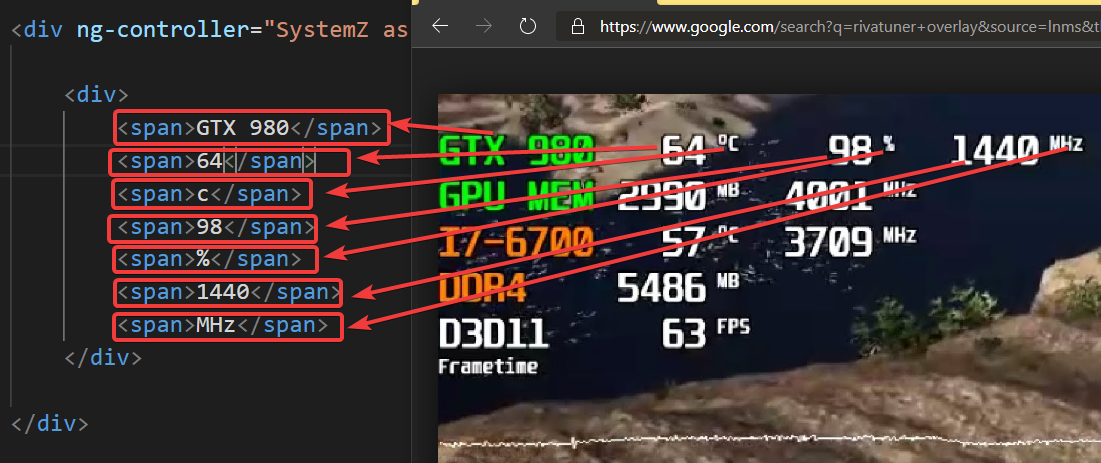
Or we can see that it is divided into 4 parts, and inside the back 3 parts, there is a part that it is a unit, like this.
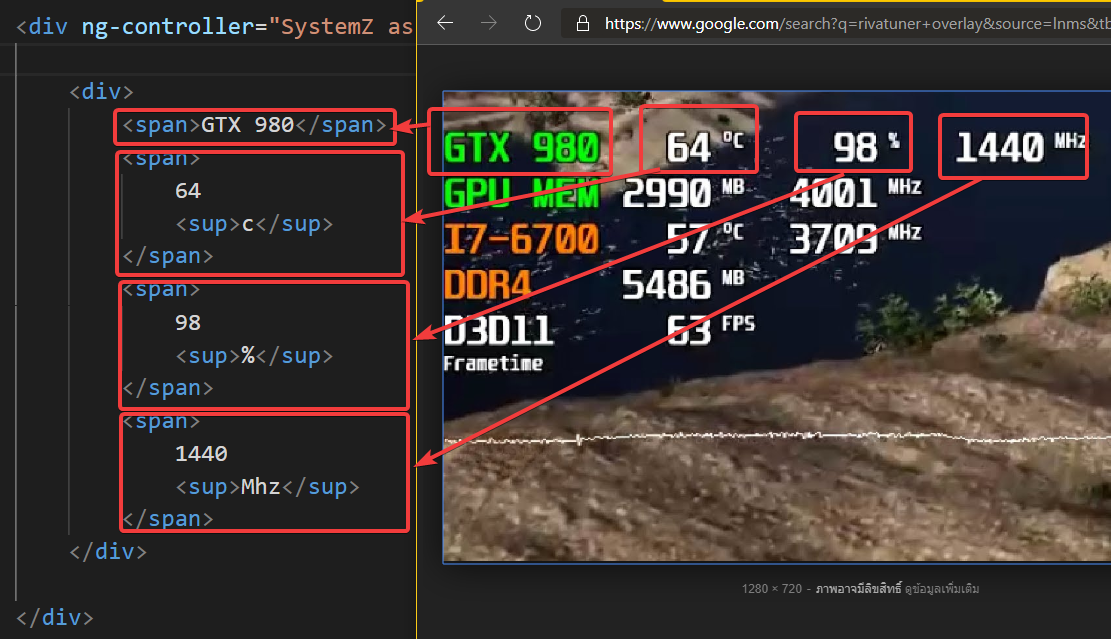
Landmarks:
- Tag sup is another Tag, inline style, which will make the character Superscript (superscript).
- We can design the tag however we like.
- When we stack the tags, we press Tab to move them, which Visual Studio Code will show us the line of sight as well. so that we can read the code more easily
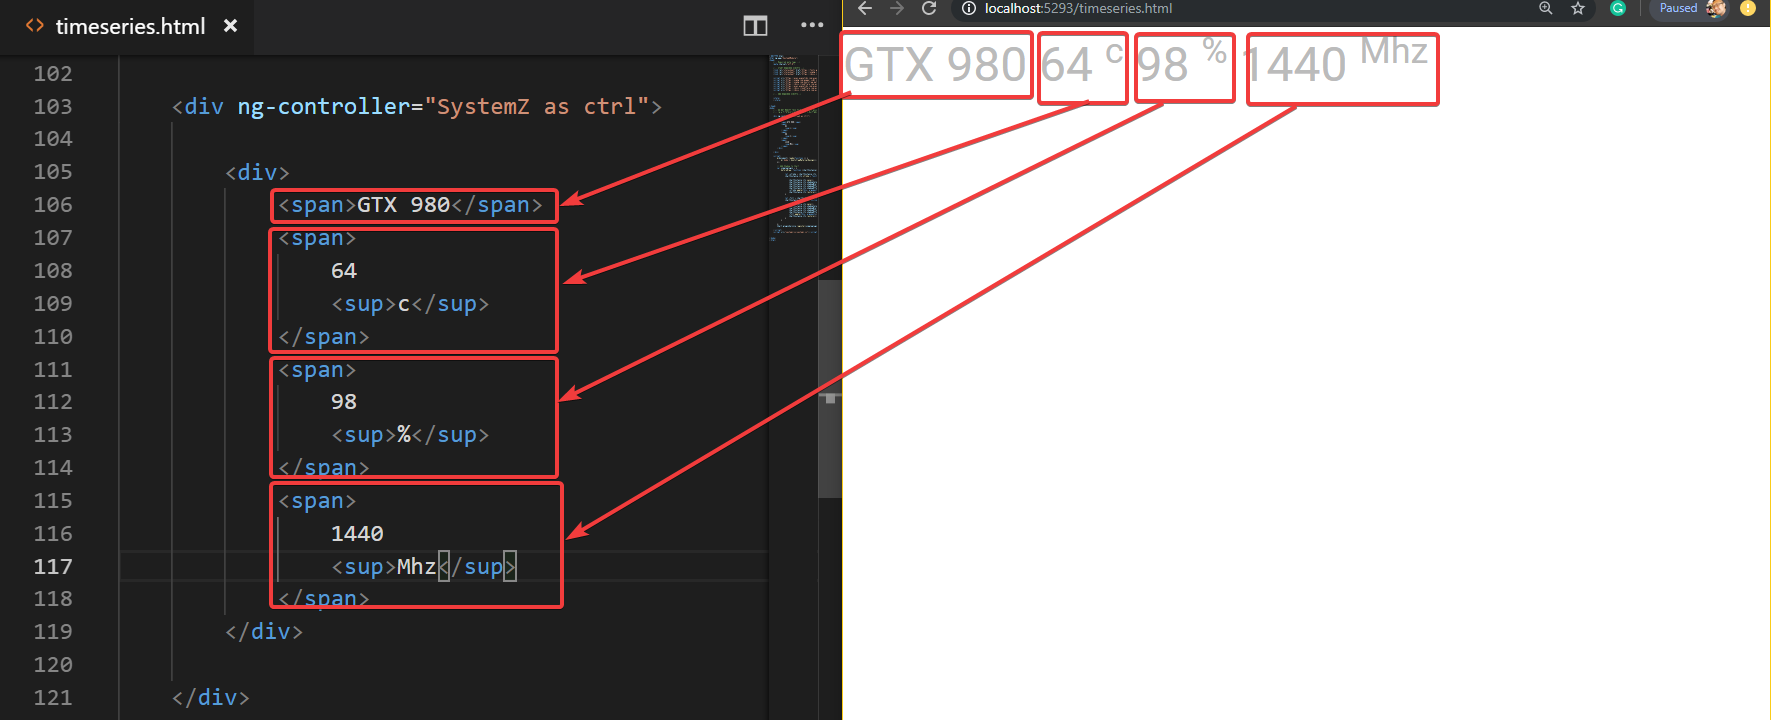
As for if it was me I will choose the second option. because it looks tidy Let's write it the second way and then refresh it. will result like this You see, it came out similar to the example.
Attributes and CSS
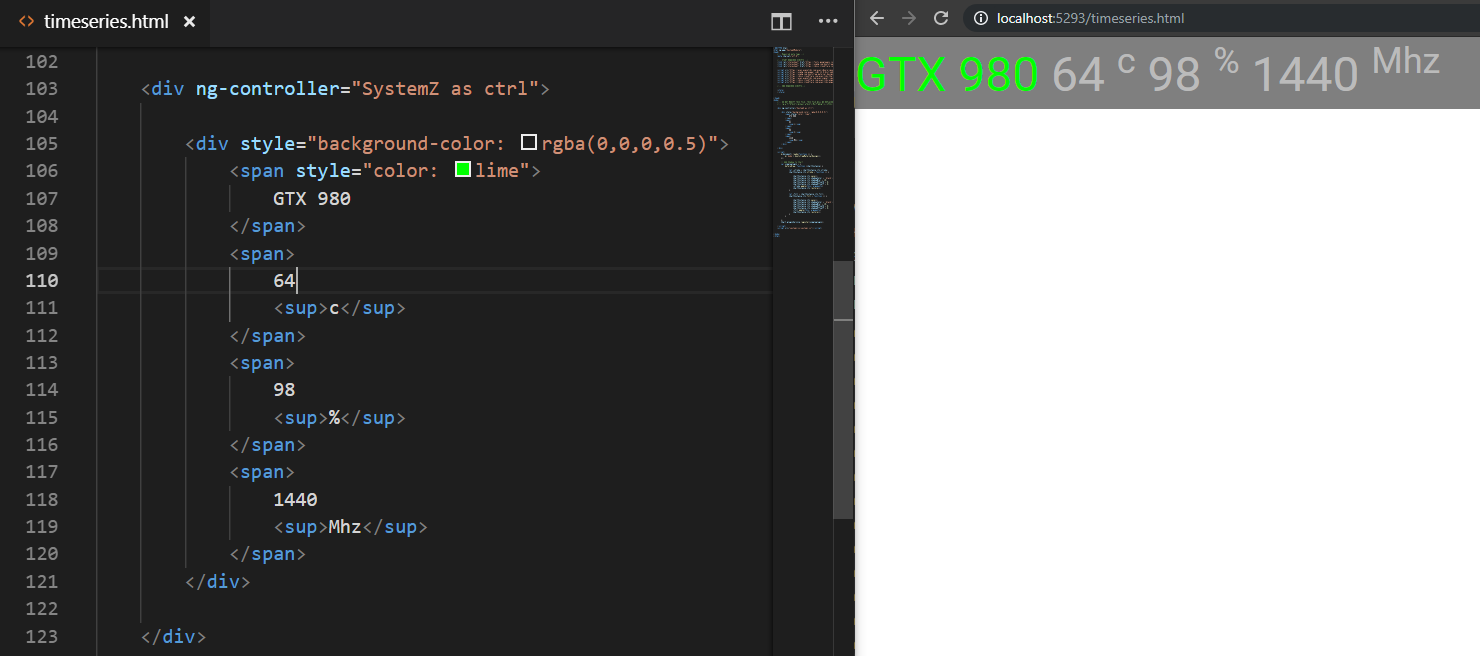
Okay, it's showing. And if we are to modify the display to our liking, what should we do? We'll be using Attribute (attributes) with Style Sheet . Let's say, first of all, GTX 980. It should be bright green. and three groups of letters after should be white We will need to use an attribute to tell the browser that we want this.
- style is an Attribute that is added to a Tag , each Tag has its own Attribute, but nowadays We choose to choose to use a regular Tag Attribute because we have to sit and remember that each Tag has what Attribute it has. We will use the middle one is style.
- "color: lime" (a square box that is colored It will show itself) This section is the Style Sheet is another language that is paired with HTML called CSS. This language is nothing much. It's the same set of properties. All tags can use the same set of properties. For example, if we set an Attribute color if it is in a Tag that displays characters It will determine that the font color will be the color that we define.
The color of CCS was originally used to write in hexadecimal numbers, but nowadays we are going to write it as the word. rgba(255,255,255,1) like this already. which we can use Google to poke a color like this
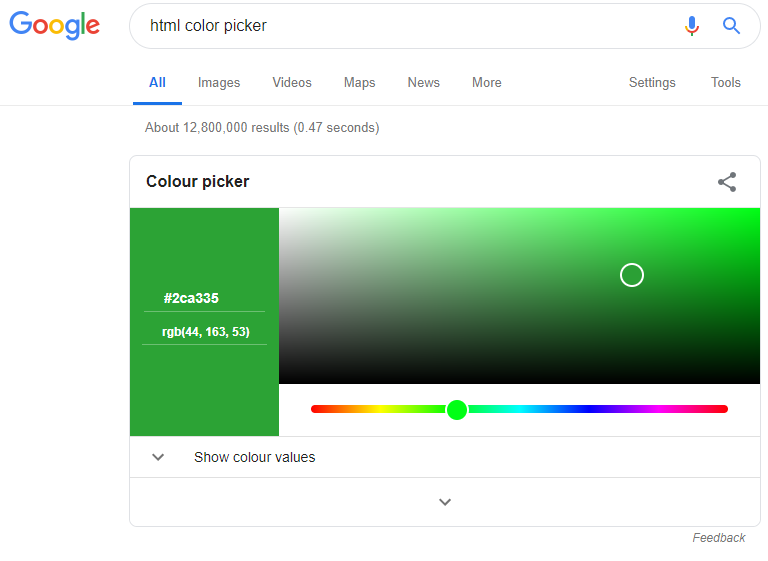
But Google's display is just RGB, no A, the added A will have a value from 0.0 0.1 0.2 0.3.....1 This is the one that determines the transparency. For example, if we want our headline to have a black background, but make it transparent past 50%, we can add a style to the div that covers our headline like this (if you want 10%, use 0.1 instead of is 0.5, etc.)
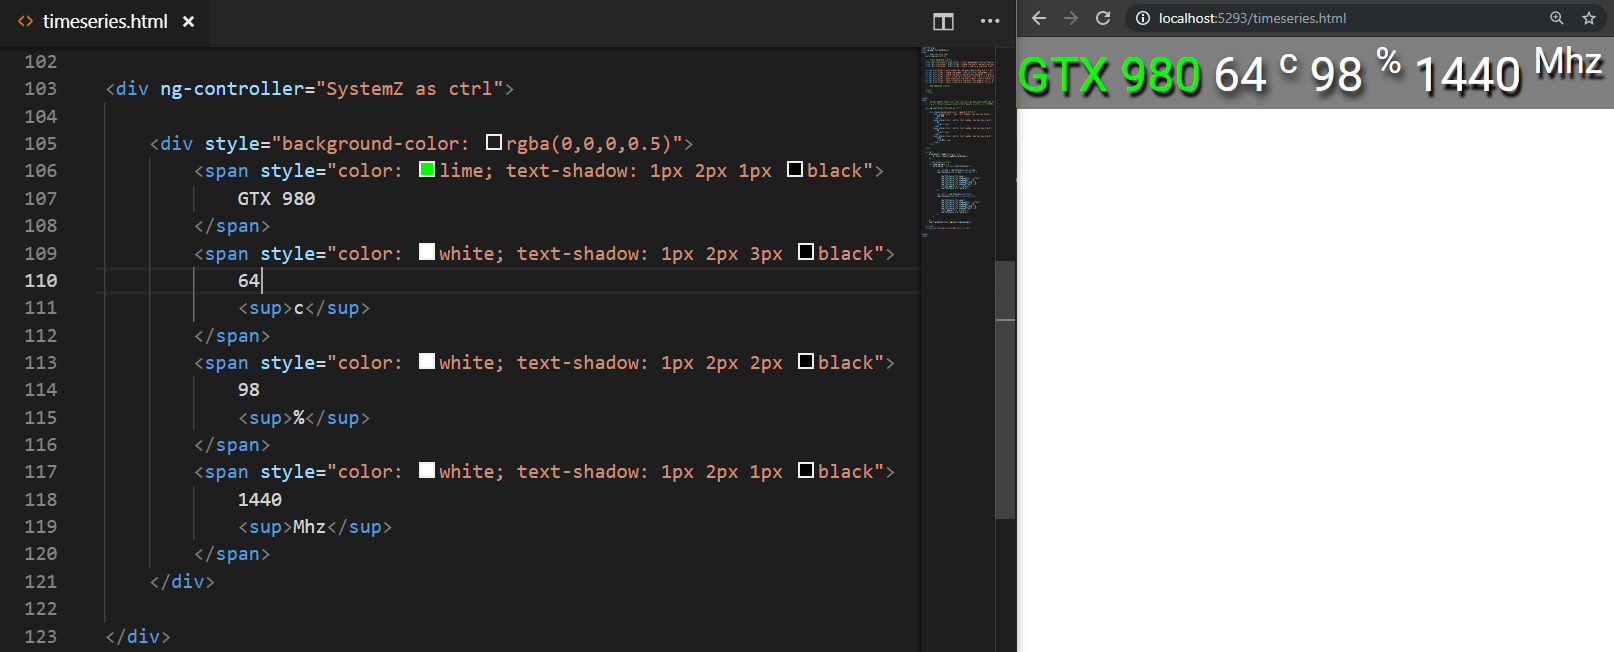
And if we want all the characters to be white, we'll need to add CSS, and if we want it to have a shadow, we'll use a text-shadow like this. Try swapping 1, 2, 3. How does it give different results?
color: white; text-shadow: 1px 2px 3px black
After we put all of them in, we can see that our code is much longer than before, right? And if going to change the Style of all the same We will have to sit and solve one by one. This is just one line If all lines are finished Then have to sit and fix one by one like this. It's enough to die.
How to use LESS Stylesheet
so that we can define the display more easily We will use something called Stylesheet to help. It is a file that only defines Style, but now we have a language that is superior to CSS called LESS , which I will use this language to write because it is written similar to the original CSS, but it does. what more
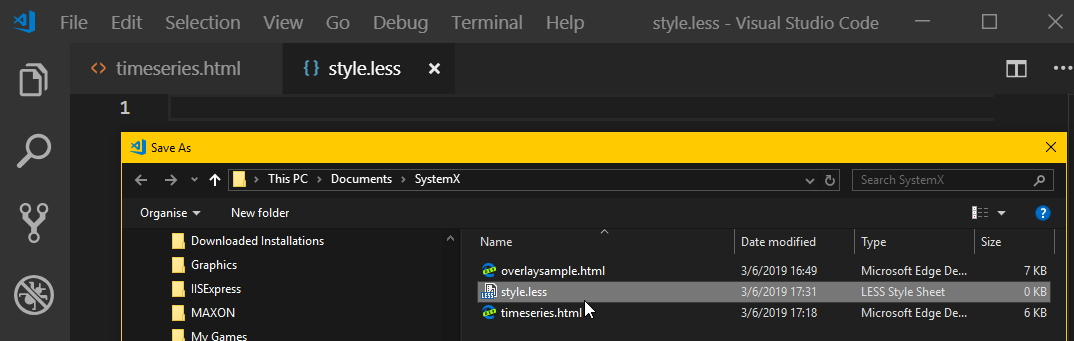
First of all, we have to create a new file first. Use menu File -> New and save this new file as style.less in the same place as the file. timeseries.html
Then we have to link the style.less file to timeseries.html file by going to the tag head of timeseries.html file as follows and put these codes in.
<link rel="stylesheet/less" type="text/css" href="style.less" />
<script src="https://cdnjs.cloudflare.com/ajax/libs/less.js/3.9.0/less.min.js"></script>
remark
- The link tag doesn't close the tag, but it is /> instead . This means that it is a tag with no stuffing. It is a Tag that has no content inside.
- href="style.less" We don't have to put a path name like C:\Windows\ or http:// anything. Just put the file name means that we need to remove the file in the same folder as the html file we are opening in. now due to file timeseries.html Now we turn from http://localhost:5293/timeseries.html The Browser will load style.less files from http://localhost:5293/style.less. (Try putting the file in a folder and find a way to retrieve it for you to see.)
- src="//cdnjs..." You will see that do not use http:// just use // in front of this means use the current protocol to download the file less.min.js because this page we Open with http:// will use http:// as well.
when ready Let's start writing LESS. The sole purpose of this style.less file is to add Style to the HTML file it connects to.
Suppose that we will make all the characters of tag span red, type like this, why not change it?

But this can be reversed (add !important to it)

This is the origin of the CSS language name. It stands for Cascading Style Sheet, meaning it will affect each other (Cascade). For the first case, our red color has no effect because we have a color defined in the Tag span. already, but when we say it's !important , our style is used
Of course, we wouldn't want all spans to be red. So we will need to use CSS Selector to help along with editing HTML to make it compatible.
CSS Selector
First, we're going to remove the messy style we just added. Only the beautiful empty structure like the first one is left. Then we have to find a way to "select" only the tag that we want to receive the Style that we set instead, which the selection can be made in two main ways.
- Using Attribute id or class where id is suitable for tags that have only one tag because id should not be duplicated and class is suitable for tags of the same type, but with the same type.
- Using the relationship between tags such as tag span inside the div, etc.
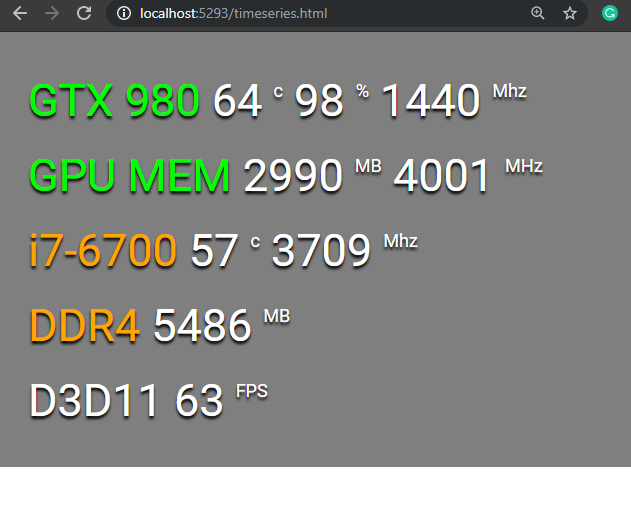
The time we actually use We're going to use a mix of both of these, as in the example case, this picture.
what we want is
- The first two lines, the first group of letters in the row, are green, the rest are white (if you remember, we divided them into 4 groups).
- two lines later The first group of letters in the row is orange, the rest is white.
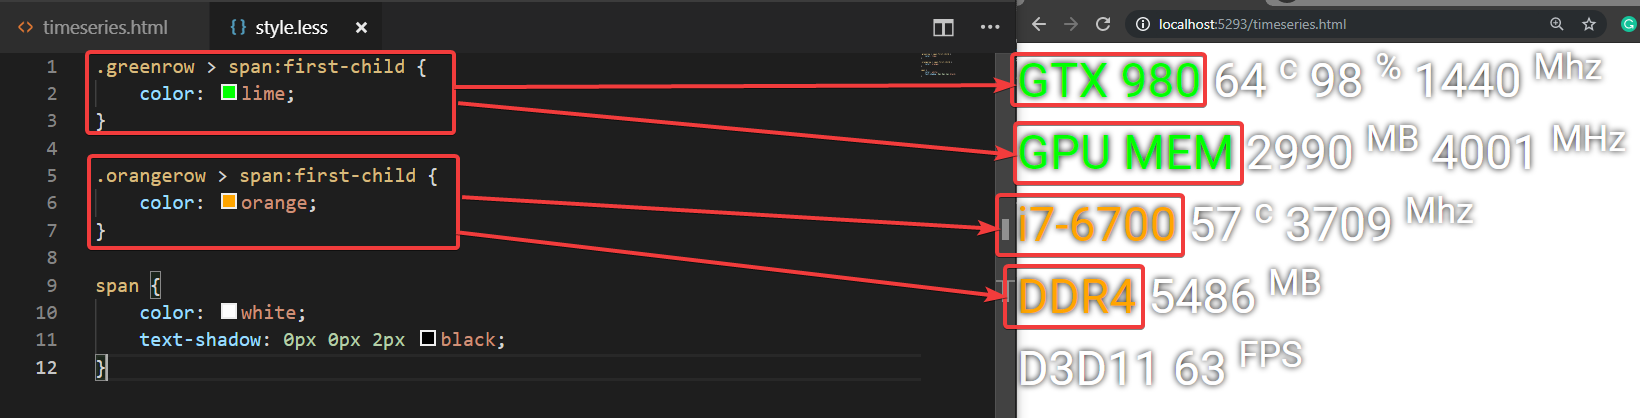
So we will write CSS Selector like this
- .greenrow Notice that there is a dot in front of it, meaning that you can tag anything that has an attribute class that has the word greenrow in it (you can add more than one class).
- For writing Styles for Id, we didn't use it in this example, but if we use it, write #box , if Tag we put the Attribute id="box" .
- > span means tag span must be inside a tag with class greenrow
- > span:first-child means that the tag span in the class greenrow is only the first tag. The next one is irrelevant
- span without specifying anything means all tag spans
Observe the results that come out.
notice that
- only the first span with the color we specify
- The span that does not match the Selector is white.
- All spans have the same text-shadow.
This is a more specific Selector Rule. Will go to set Style to overlap with less specific ones. The first is that all spans are white and have shadows, but with our specific selector So it changed white to green and orange, respectively, but the shadow remained the same .
If we write in LESS, it can be written like this. Note that writing LESS is close to the actual structure of HTML, making it easier to read and understand like this.
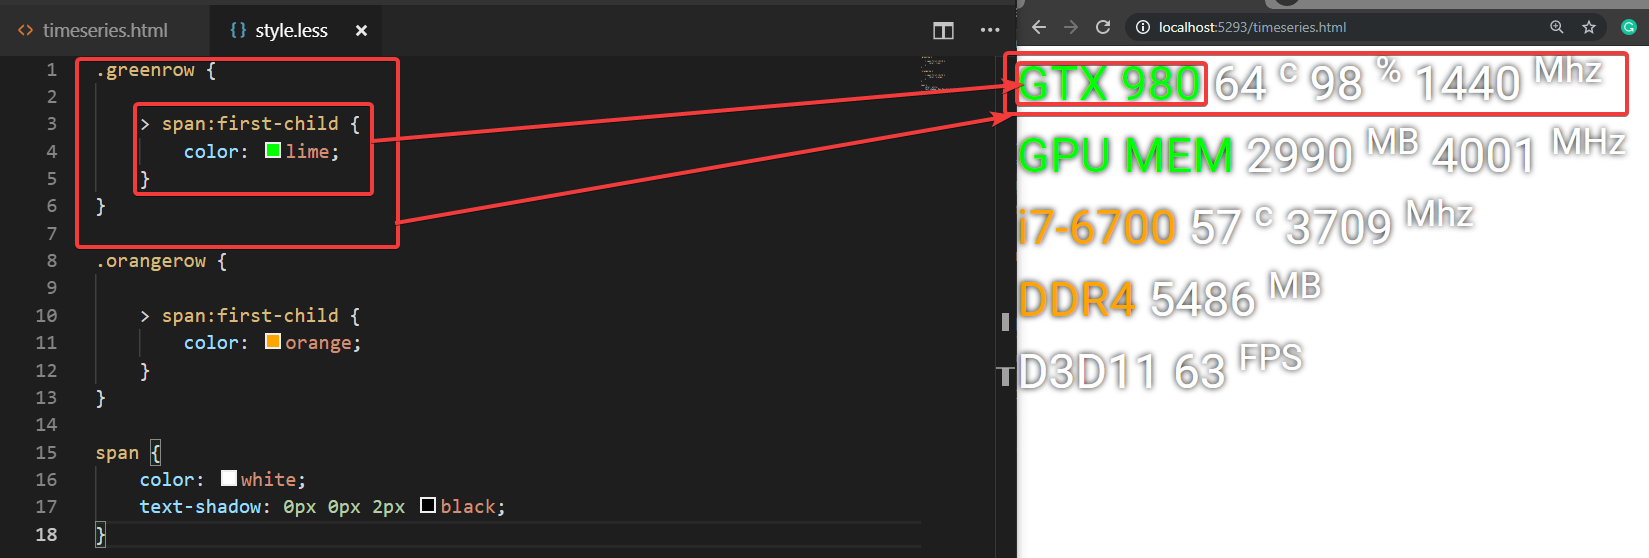
And another advantage is If we want to write a nested selector like this often We don't have to write in front of it many times. Let's say if we want to change the color of the last span as well. To write in CSS, we'd write Selector .orangerow > span:firstchild and .orangerow > span:last-child , which have the same .orangerow .
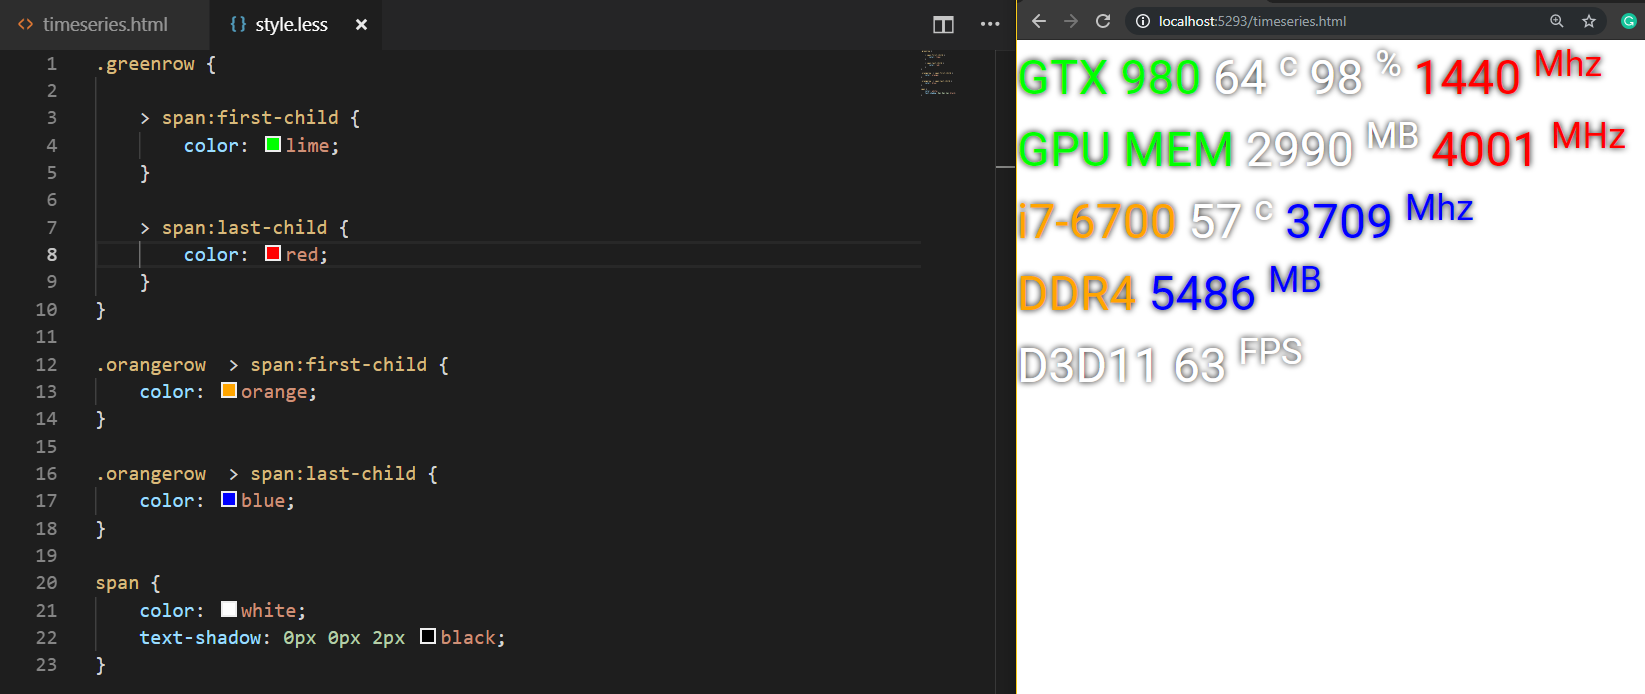
On the HTML side, we just add the classes greenrow and orangerow to the line divs like this:
And try to find a way to write Style to get the result like this. Hint that you need to add Selector for sub and use line-height, vertical align, padding, background-color . Help to make the letters come out like this. and has a transparent black frame like this
Introduction to Angular Binding
Well, now that we know about tags and attributes, and we've written a style, enough of that, now we need to show the actual data.
First of all, notice that there is a div with attribute named ng-controller . This tag is a link between the SystemZ JavaScript code that I wrote and the HTML file. Specify whether this div is a controller or a controller. Controller named SystemZ and within this tag are all within the scope (scope) of this controller.
For this controller, I have created 3 variables as follows:
- telemetry is a variable that stores a summary of the temperature, CPU/GPU speed at that time.
- sensor is a variable that includes all Sensors that SystemX reads out.
- fpsProcess is a variable that stores all fps information.
which to use these variables We will use to write Binding Expression which is a special code language of AngularJS that is similar to JavaScript into HTML. For the sake of confusion, we recommend you to copy the overlaysample.html file. came out as another new file to test writing first
Let's start by trying to type in between the tag div. This means to display the variable named sensors. We will get the result in a strange message. And the most important thing is that it will change continuously.
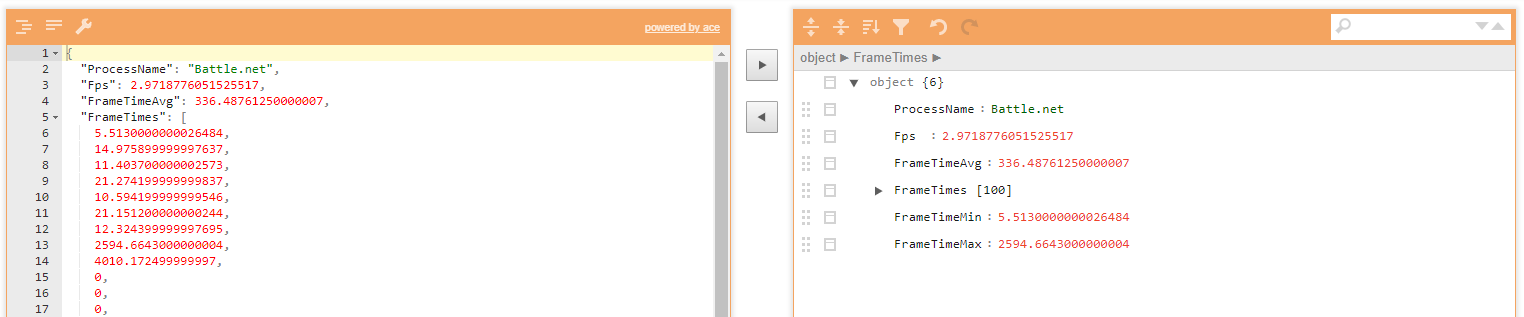
What you see in this weird text is JSON (JavaScript Object Notation) . It's a structured format for displaying data. It is commonly used nowadays. A simple way to know what the data looks like is to create a tag called textarea and put a binding expression in the middle. We will get a box for typing that can be CTRL+. A, CTRL+C The data can be easily output like this.
and then put it on the web JsoneditorOnline.org to see its structure by pasting
But for general information There is no need to search for individual sensors because SystemX will summarize the preliminaries already in a variable named telemetry that has this structure.
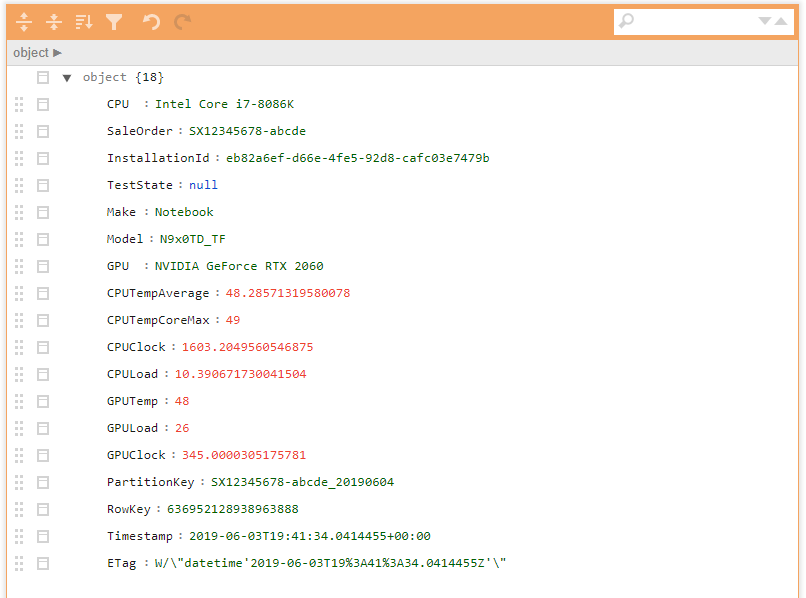
back to page Our timeseries.html where we write the Style and hold it, if we want it to display as real data, just change the pseudo-text that we typed into Binding Expression like this.
Landmark
- A telemetry variable is like a collection of data. There will be more information piling inside. Each of these data can be called an Attribute (same as HTML) or Property, referring to both properties.
- The telemetry variables that are this group of data we call Objects represent what we are interested in.
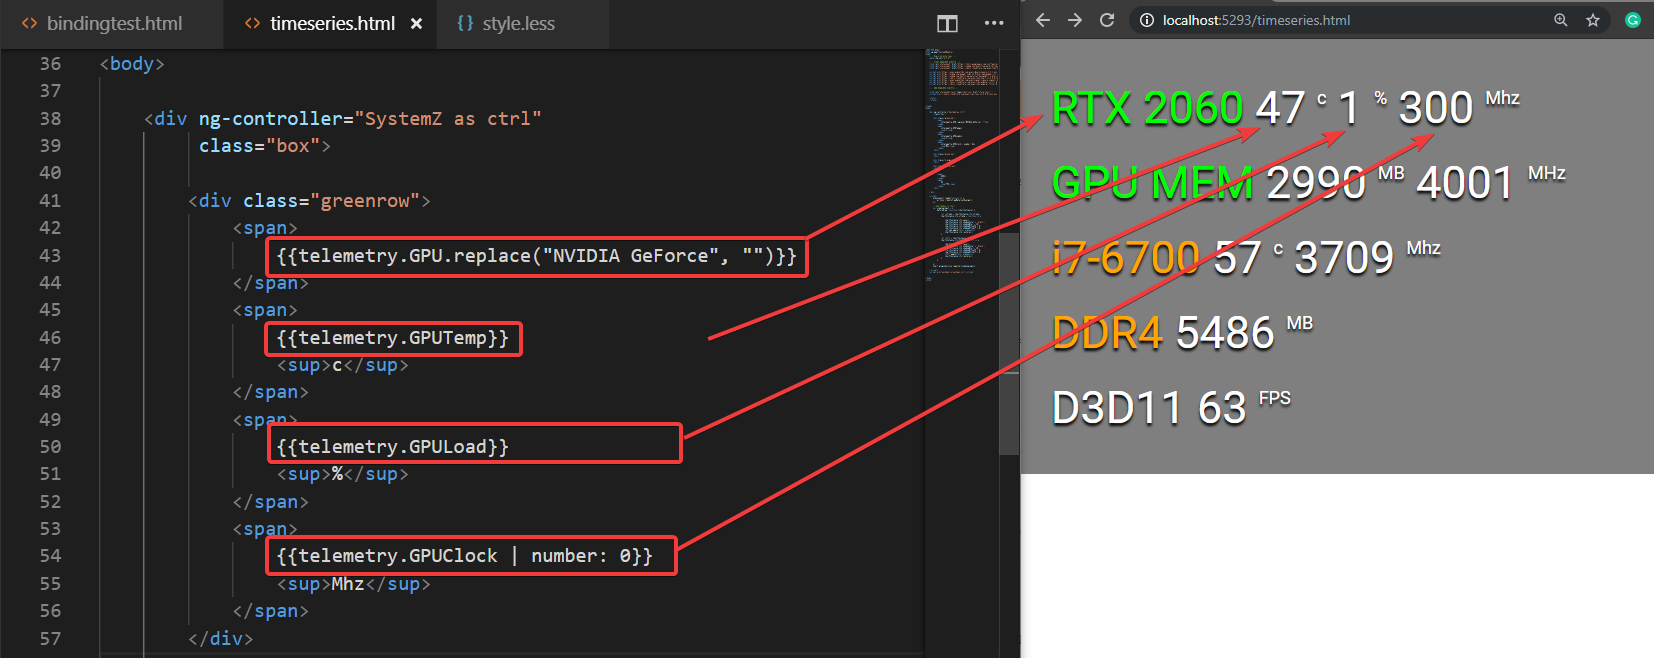
- To read the GPU name, which is the video card name, from the telemetry object, we use the telemetry.GPU separator. which we should get the word NVIDIA GeForce RTX 2060 out
- Because the word NVIDIA GeForce RTX 2060 itself in JavaScript is another object called string means text . String objects have functions (functions) tied to it. One of those functions is called replace, which is a function. It accepts two variables. The first, labeled "NVIDIA GeForce" , is the string to be replaced, and "" (two adjacent mouse marks, called Empty String) is the string to replace. As a result, we can only get the RTX 2060 out.
- GPU Clock should be a decimal number, but we have to use a filter to cut the decimal number out to 0, meaning there is no decimal point.
but in the next line There will be a slight problem because the speed and the amount of VRAM are not in Telemetry, but it is in the Sensors. The way to get the value from the individual Sensor can be done by opening the Sensor Id first with JsonEditorOnline. We will find that the sensor we need is GPU Memory Clock, and GPU Memory Used .
We can read the value from the Sensor using Binding Expression like this, that is, the sensors variable has a property named map, which I have made it mapping like we can put String into it (string in JavaScript will use mouse teeth or symbols. ' okay)
When searching for all sensors, we will get results like this. Congratulations, we're halfway through!
Using the sz-timeseries Directive to display graphs
In addition, you can see that in the Reference image, there is a graph of FPS in it. Let's see how we can make a graph like that. First of all, we have to copy the code that is the canvas from the overlaysample.html file. Let's put it first and there will be a graph like this.
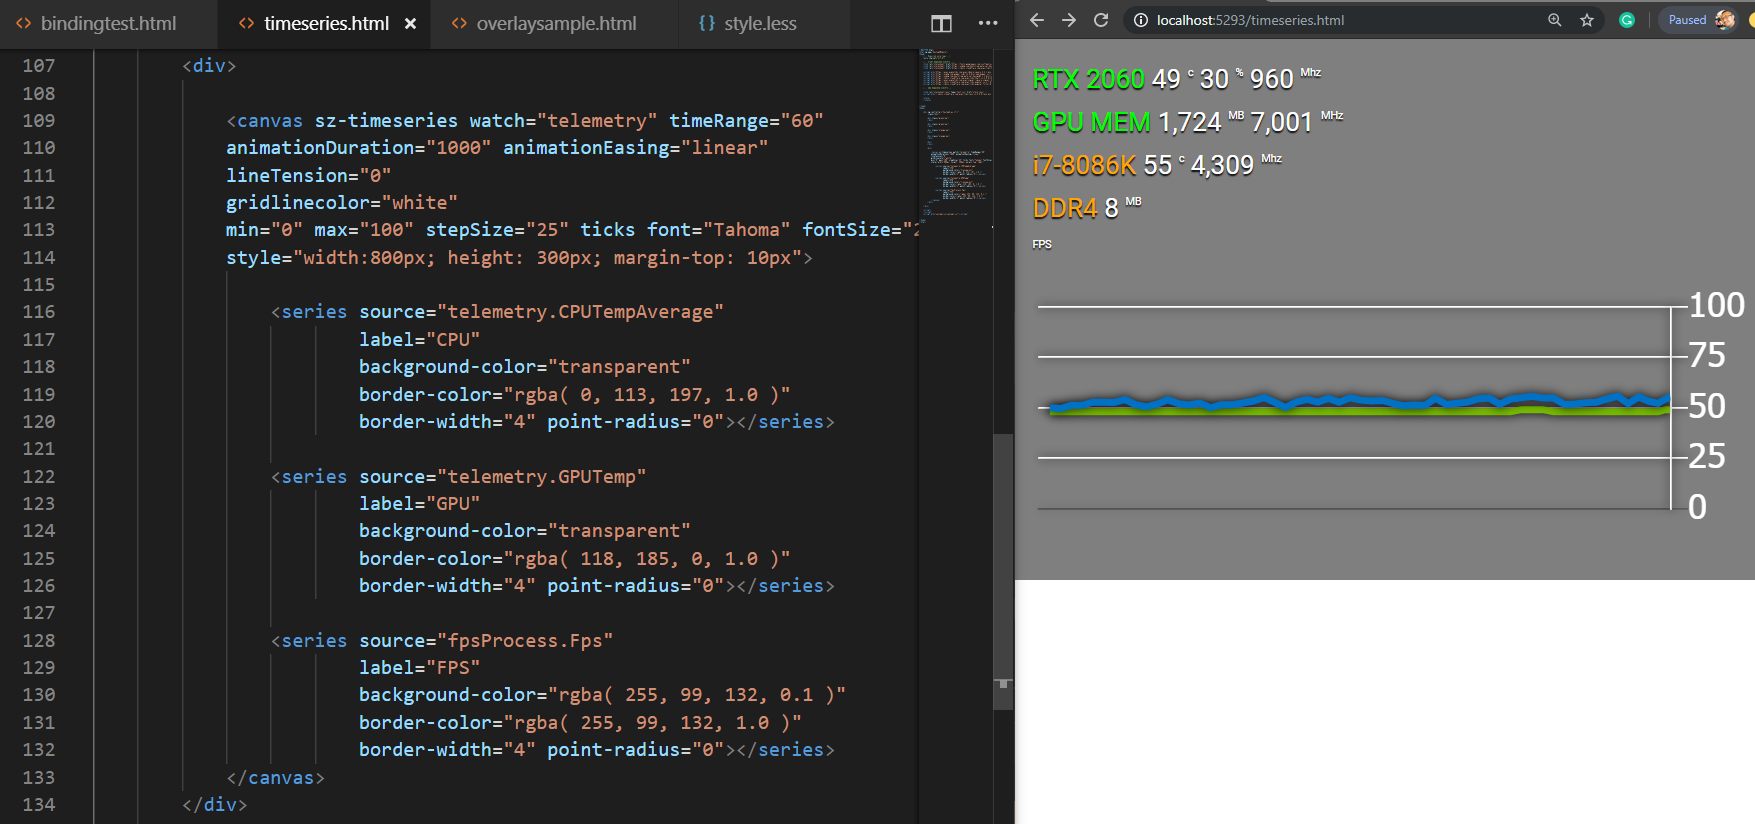
It would be enough to guess that this Directive will be an Attribute that can be pasted into the Canvas tag, which will automatically turn it into a graph (Magic!!!) with many different Attributes, which in the example written for It's all that can be played, but the Attribute that we will be interested in will be as follows.
- watch Attribute This will be a variable that defines When will the graph be updated? By now you can see that It is set to telemetry, meaning the graph will be updated. As soon as the value of the telemetry variable changes, the SystemZ web page receives new information from SystemX.
- Attribute source of Tag series from within the structure It should be suffice to say that the tag series will determine that In this graph, what lines are there (Series), in the example, there are three lines, which are CPU, GPU and FPS, with each line taking a number from this source to show?
The fpsProcess variable has the following structure:
The Attribute that we will change will have only the source from the original CPU/GPU/FPS has been changed to FrameTimeAvg, Min, Max from fpsProcess instead
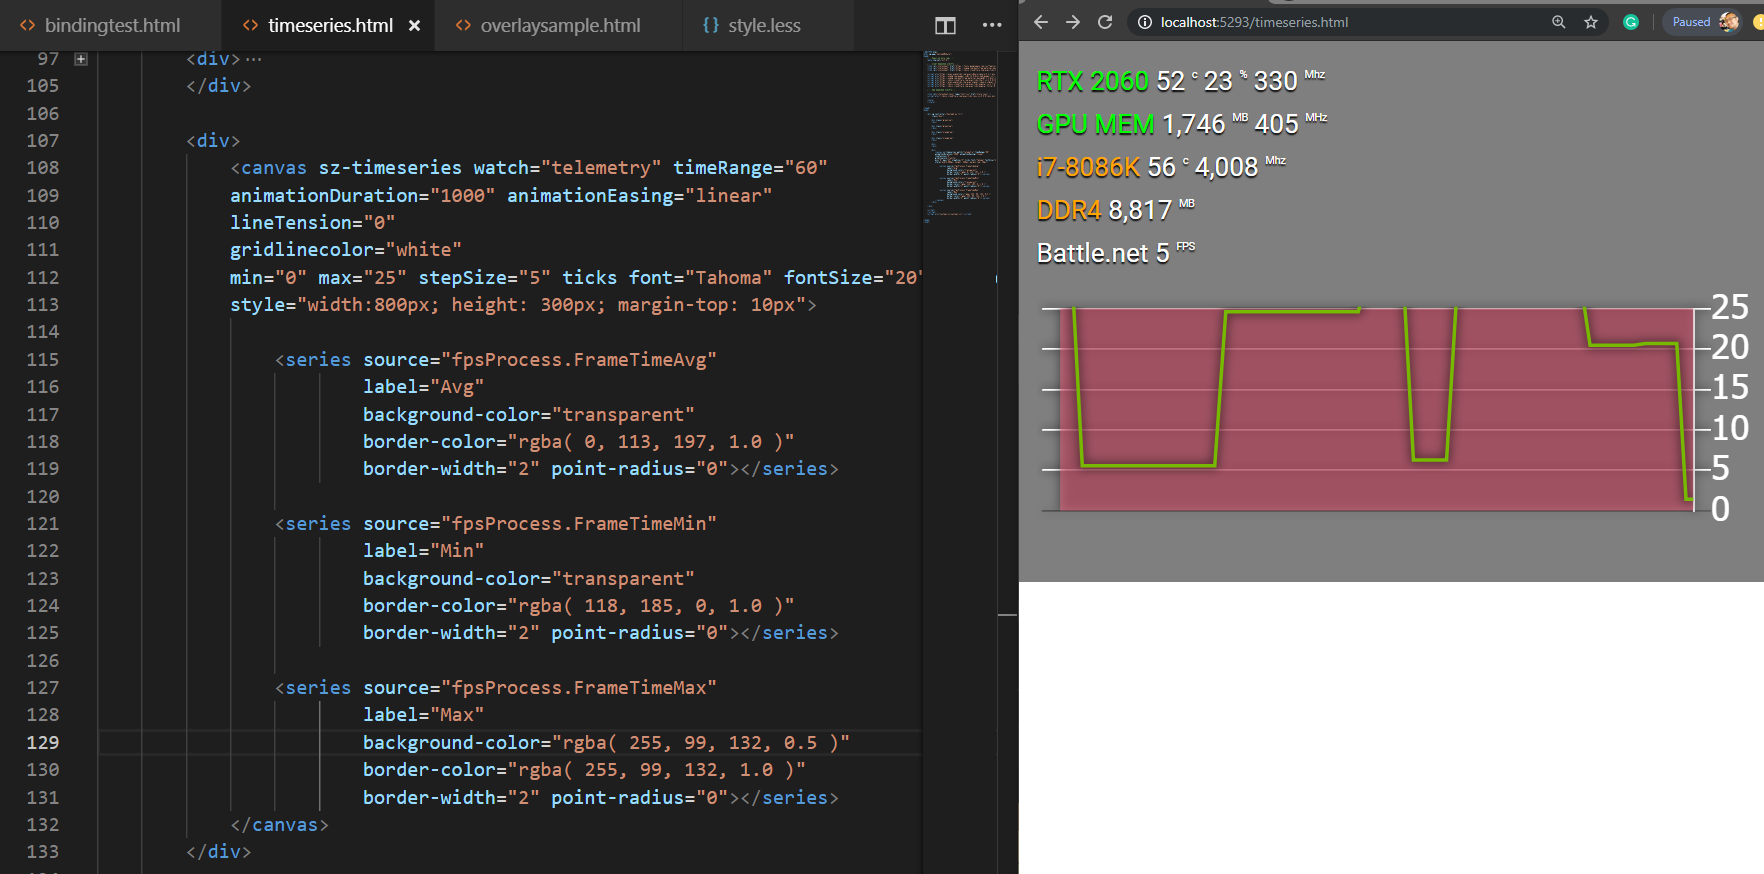
finished!
Now all that's left is how to use this Overlay. Thank you very much for reading until here. Hope to get some basic knowledge of HTML / CSS / AngularJS along with it.
where to use Don't forget to come back and tell us some!