


I think there are many people who would like to try to do a review. What is a YouTuber with them? Because of this review Half of it is a very rewarding job. is to open the test here and play games to test the device It's a dream job for many people, I think.
But the difficulty, it will come down to that We have to sit and open many programs in order to get information for review. For example, I mainly use hwinfo (which has a free graph viewer here ) along with PresentMon to capture Frame Time / Frame Rate of the game. To be stored in a file (called Log File ), both of which are programs. The result will be a mixed .CSV file. Be careful. and give the file a good name
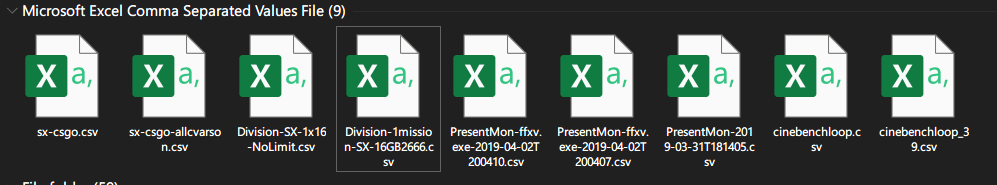
Once the files are organized and not confused, then I will have to continue to be confused in Excel. I have to sit and organize the data. make it square Then I made a graph, put the formula for Min, Max, Average, Percentile and something like this. After repeating it for several months, I started to feel that Why is the life of a review so depressing!!!
Now we already have SYSTEMx and it can read Sensor values already, we manage to make it store Sensor values into a file~
IF YOU DON'T HAVE SYSTEMX YET, INSTALL IT HERE.
How to turn on Logging in systemX
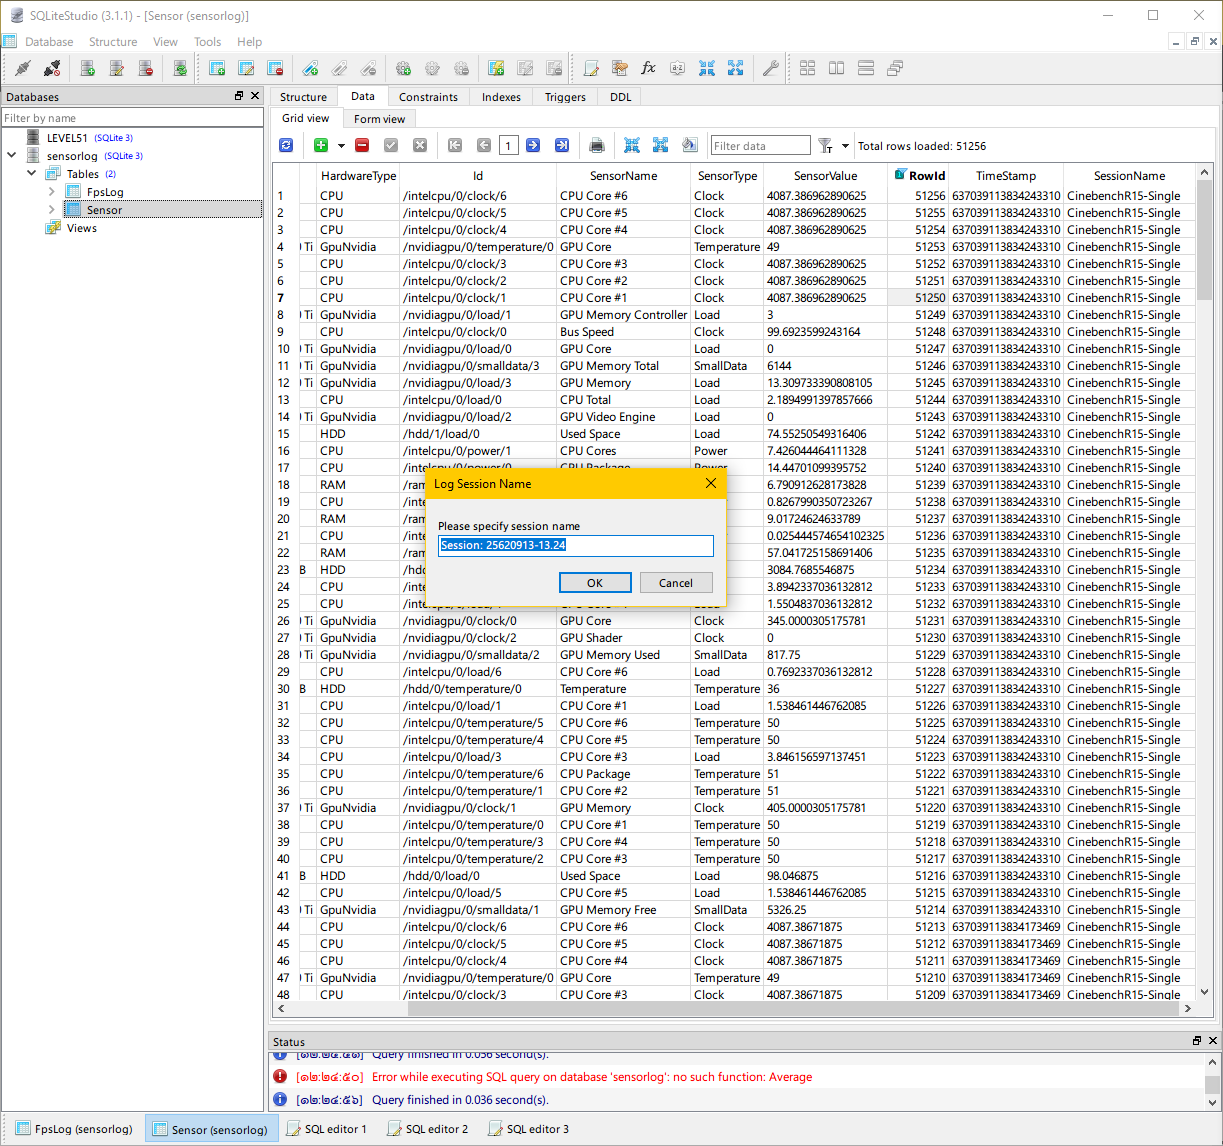
For this sensor data collection feature, I actually put it a long time ago. because it will be used to make a review Anyone who uses SystemX can activate it. By right-clicking on the 51 icon and selecting Save Sensor and fps Data , it will start the Log collection system. The system will ask what program to keep the Log this time. Or what to do with (Session Name), just specify it.
Oh, the system will not check if the name is duplicate or not. You can enter anything. If the Session Name is repeated when reading data. It is assumed to be the same set of data. Just in case you want to pause and continue saving, something like this.
For those of you who have studied Database , may feel embarrassed because I didn't do any normalize at all because of the speed and ease of querying (so you don't have to JOIN ) and the SessionName column already has Index . too Another thing is that Strorage is cheap these days. We don't need to save the SessionName repository, which can be rewritten, at most it's less than a MB saving. :D
For viewing the log, you can use a program that reads the SQLite database. I chose SQLite Studio because it can do a lot of things. It's like a big database management program. At first, I intended to write a query myself and then export it to Excel, but think again. Here it goes back to the original Loop :P Thanks to Nong Folk. that allows me to have a little more free time (Really a little) to add more features, that is systemX Log Viewer!~
systemX Log Viewer
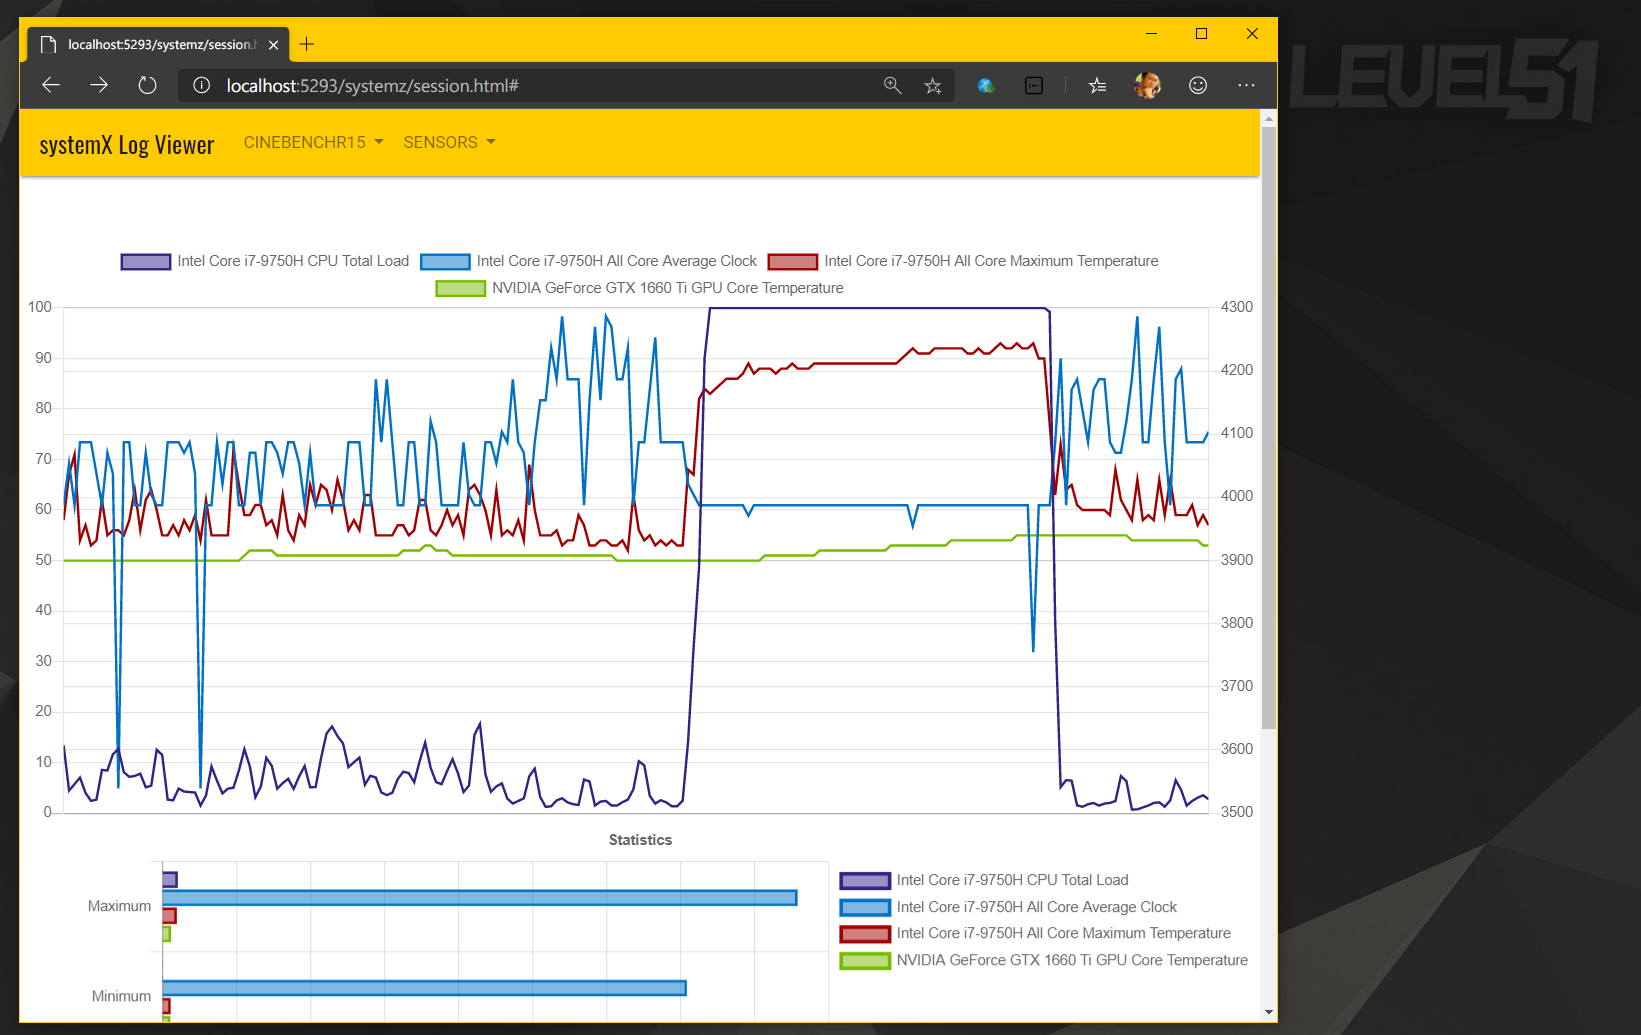
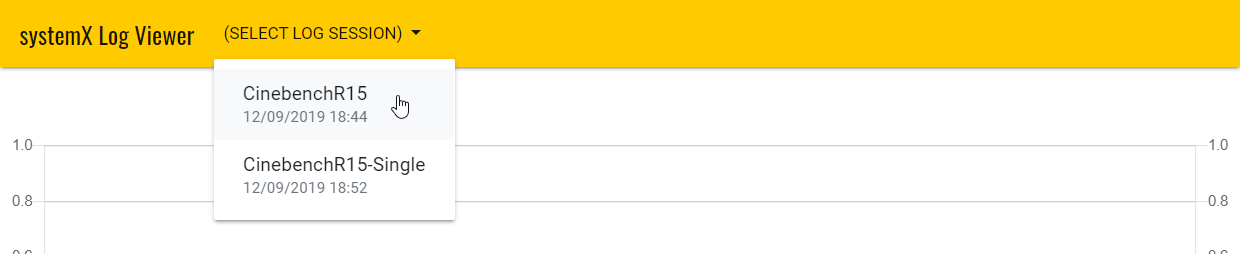
As for how to use it is very easy. Just right-click on the 51 icon and select View Log . This will bring up a web page. Then select Saved Session from the first menu.
Once selected, the display will display a graph of CPU Load (% CPU Utilization), All Core Average Clock (average speed of all cores on the CPU at that time), All Core Maximum Temperature (the highest core temperature at that time). that time), GPU Core Temperature will automatically come up.
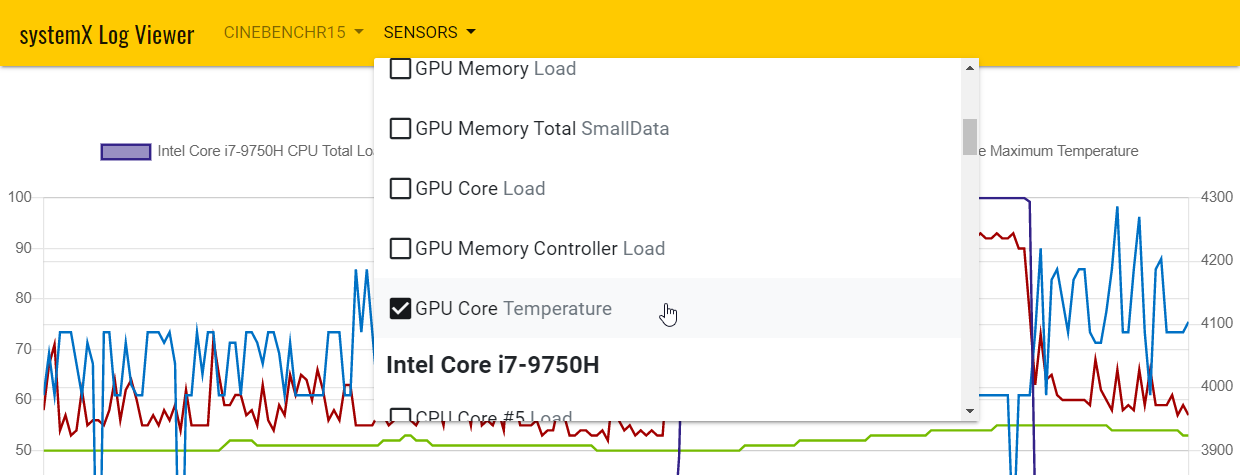
If there is a sensor that wants to see the value added It can be selected from the Sensors menu. If you want to remove any one. Just press the sensor again to remove the display. There will be a check mark in front.
how to read graph
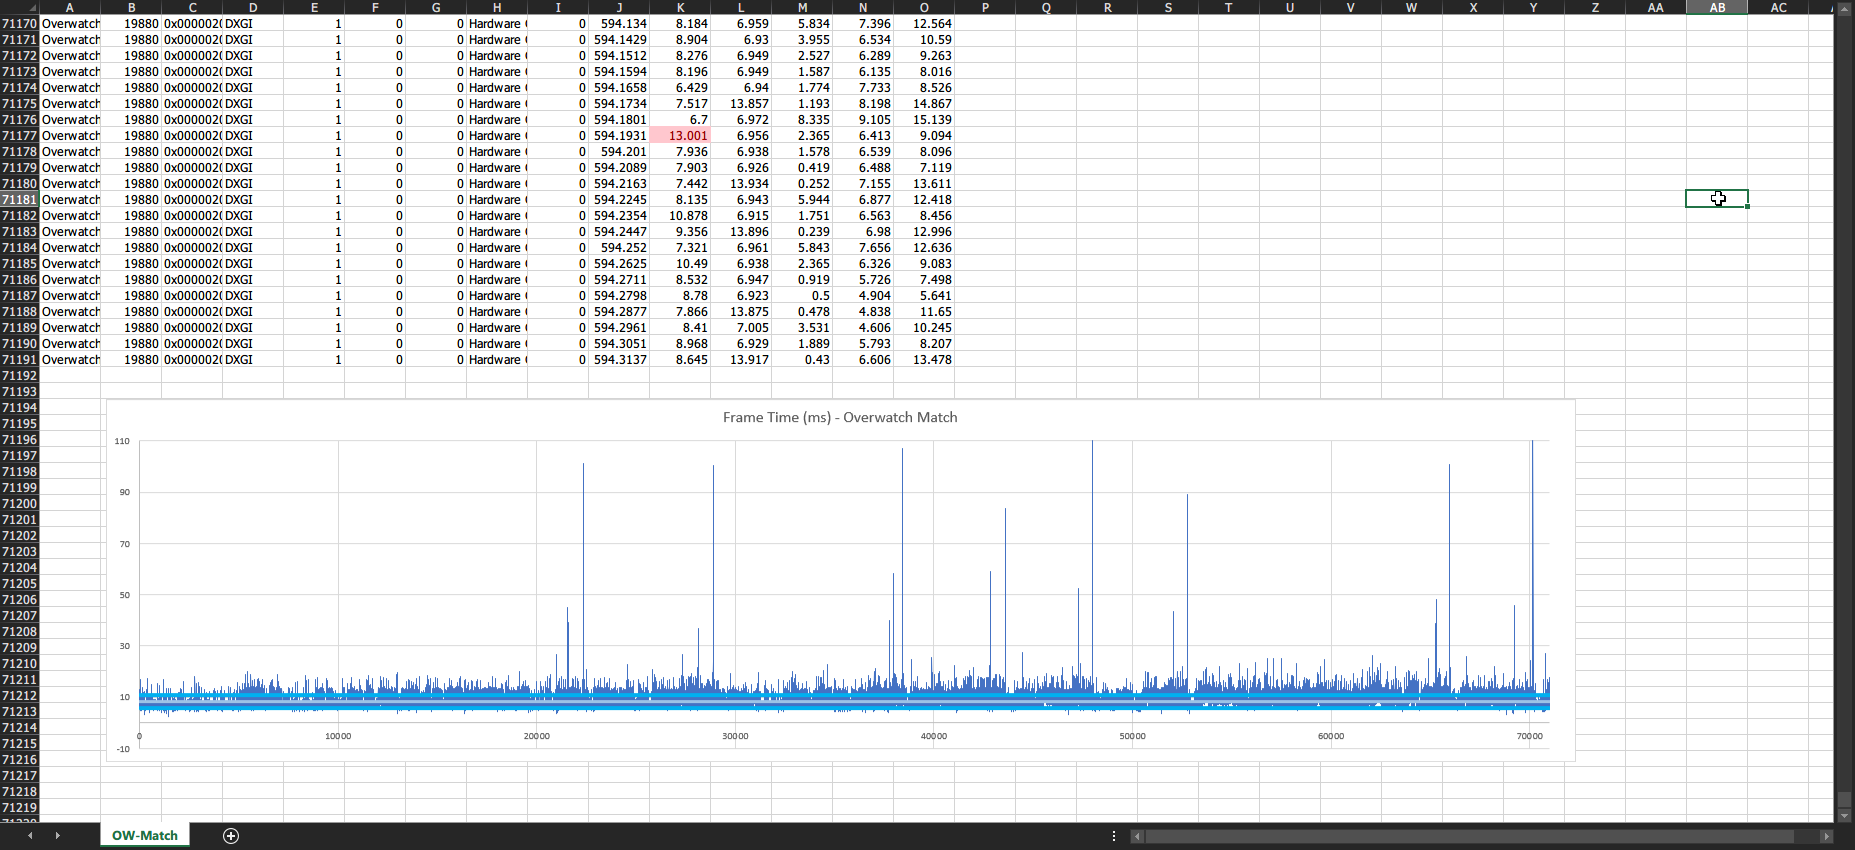
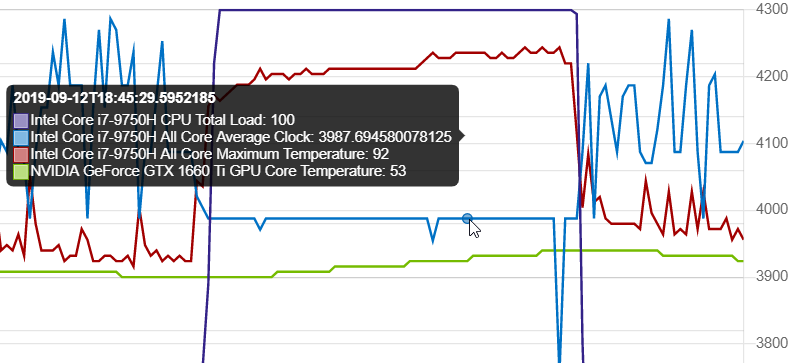
For graphs, there are two graphs. Is data with time ( Timeseries ) by which this graph will split the Y-axis into two axes, namely the left axis is the data axis with a maximum number of not more than 100, the right axis is the axis of numbers that exceed 100, but it does not affect the read it because the graph will adjust the values to the same can be used for comparison
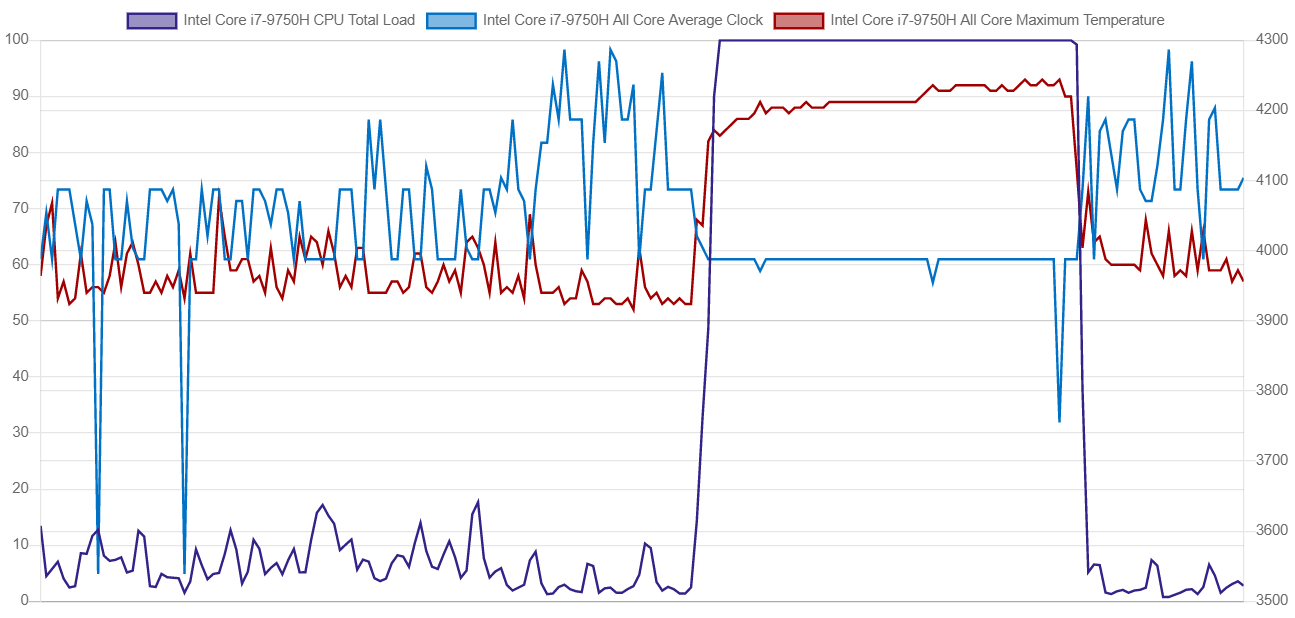
As in this graph, running Cinebench on a GG machine shows that in the 100% CPU range (purple line), the heat is around 90 degrees and the speed is close to 4000.
Then you can choose to see the values one point at a time. by bringing the mouse down to the graph to read the data
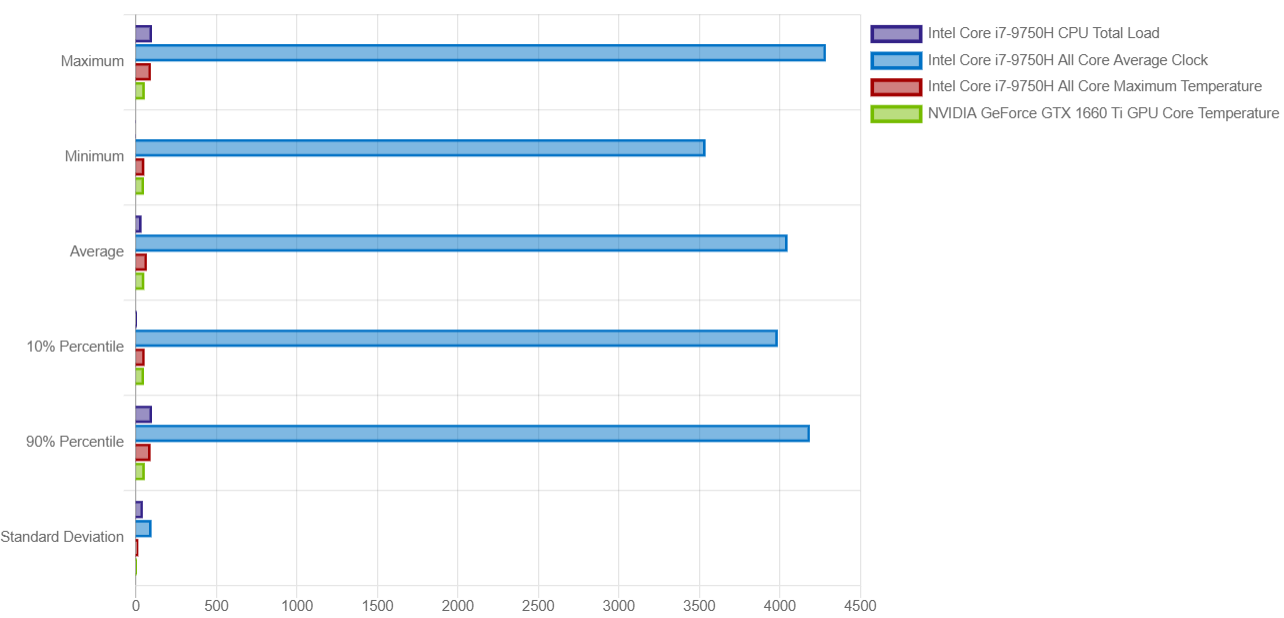
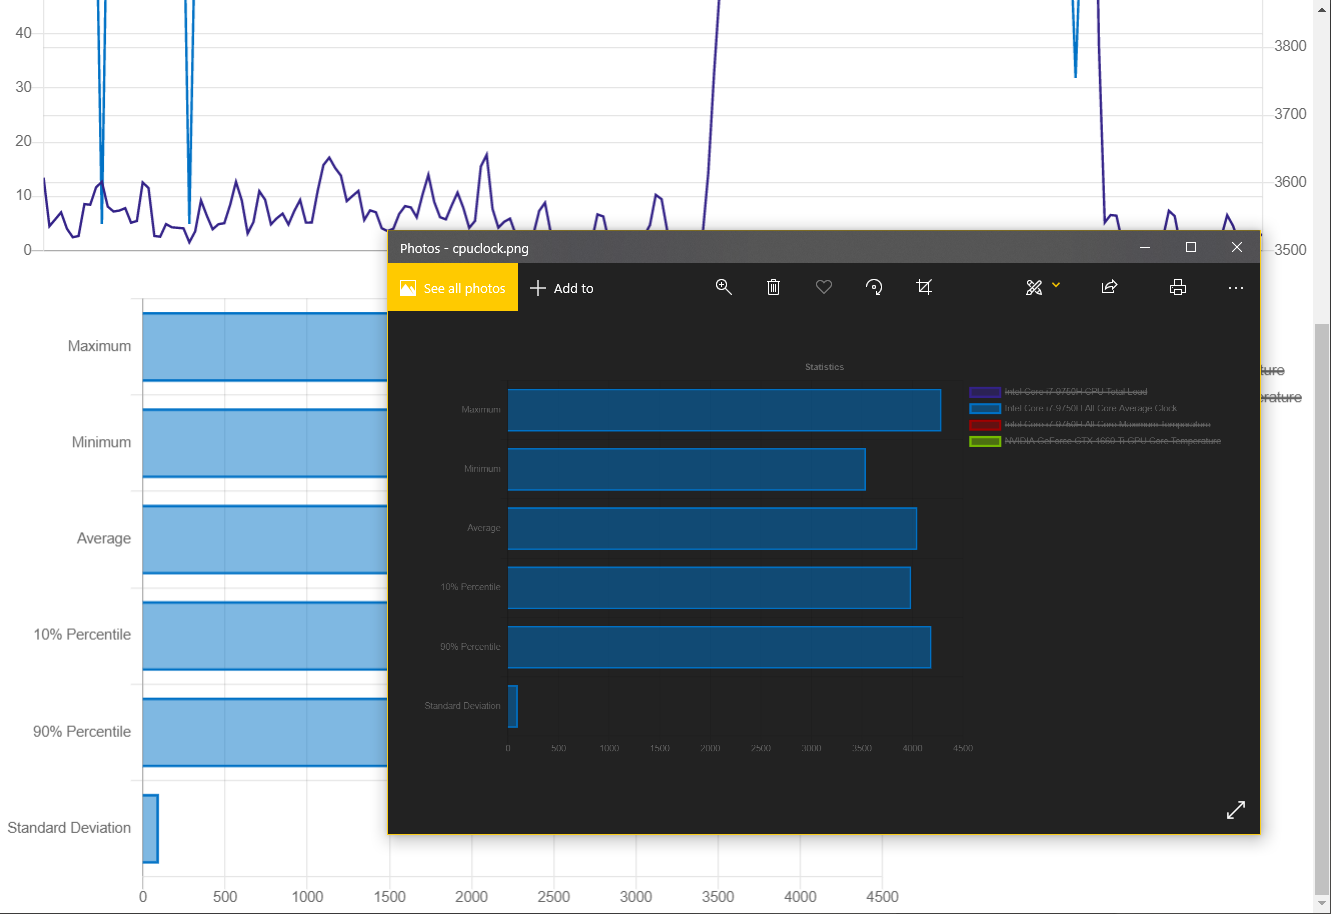
graph section below It will be a graph summarizing the statistical data, including:
- Min, Max, Average are the lowest, the highest, and the average.
- 10% Percentile means if the data is arranged in ascending order. The smallest value of the first 10% (if the data contains 100 characters, then the 10th character) cannot exceed this value.
- 90% Percentile is if the data is arranged in ascending order. The lowest value, the first 90% is no more than this.
- Standard Deviation is the standard deviation, which is how much each value differs from the mean. If this value is less shows that the value is relatively constant. Not much different from the average
In this graph, if there is Clock Speed data in it, it will bounce a lot like this.
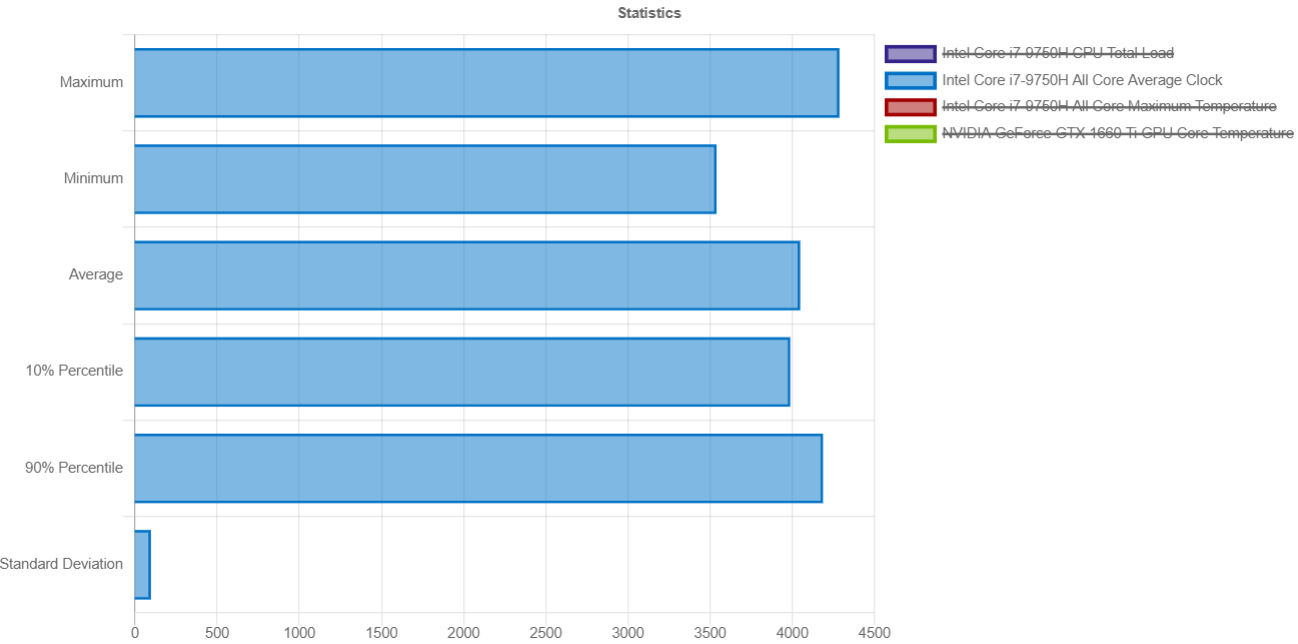
which we can turn off some values By clicking on the Legend on the right, this design will be drawn.
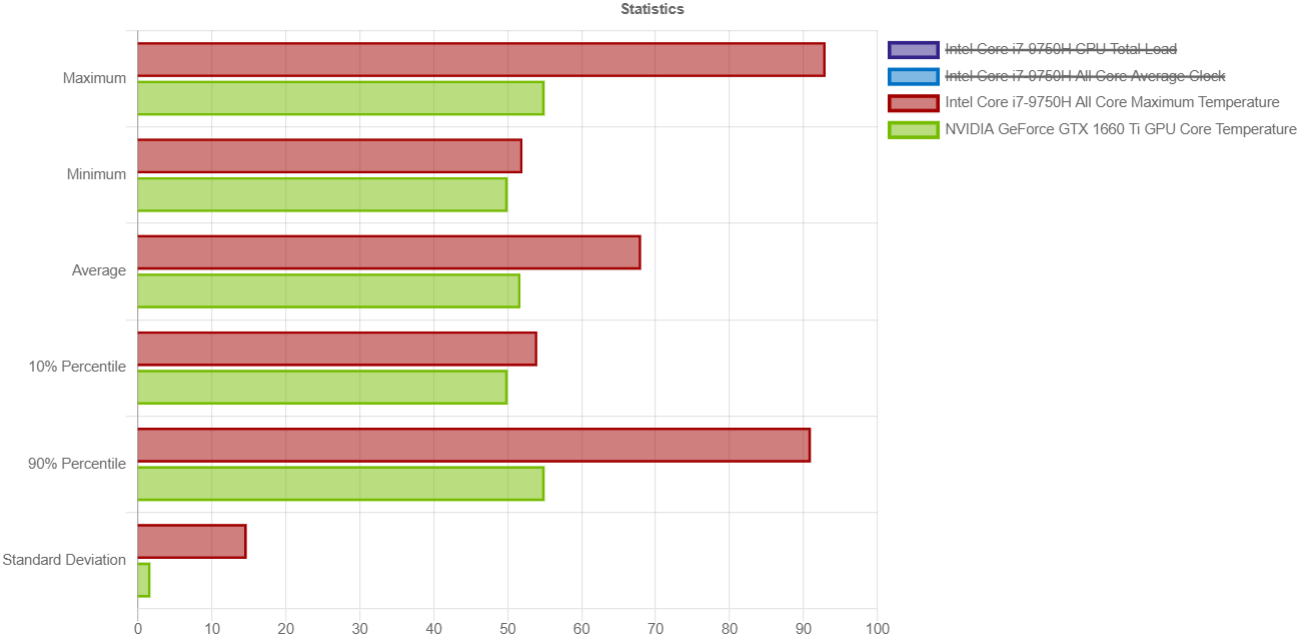
All this information is put together. will help answer that The range of the readings will be roughly like the temperature of the hottest Core. It is in the range of 55 - 91 and the average core performance is always in the range of about 4.0GHz.
Then we can save the displayed graph. out as a picture By right clicking and selecting Save, you will get a transparent PNG image ready to use.
Adjusting the display of graphs and screens
As for the Log Viewing screen, this is a screen created with HTML as always, and you can take the HTML/Script I wrote. to apply to make the face look up as you like By saving it in Folder Systemx located in My Documents, it will be able to open files from URL http://localhost:5293 immediately.
The corresponding files will have:
- http://localhost:5293/systemz/session.html This is the home screen. It shows how to run Library Systemz. The graph shown uses ChartJS .
- http://localhost:5293/systemz/js/systemz.js This is a Library which contains There are several Directive/Controllers written in AngularJS, the one associated with this page is the Controller SystemZSession .
for display adjustment Must have knowledge of AngularJS / CSS / HTML together for this post. Please don't mention it. but it is recommended that You need to create a Controller and put it under SystemZSession again, you can use ctrl.sessionStats and ctrl.sessionTimeseries editable
If you only want to edit the font, you can do it by using this code.
    <div ng-init="ctrl.font='Leelawadee';ctrl.gridColor='red'">
    </div>
which values that can be changed have
- ctrl.font : The font on the graph.
- ctrl.legendFont : Legend Font
- ctrl.color : font color
- ctrl.gridColor : Line color
end
Hopefully this feature will make it easier for you to review. Or if you want to just plot the heat graph for playing, it would be easier. I'm also preparing to do a review of the GG machine. Having this system helps me a lot. Get ready to meet the review of GG from LEVEL51 very soon.